
The UK Equities Grandaddy ETF
The stellar track record of the S&P 500 is the foundation of modern investing. But what if index trackers had been invented in the UK in 1900? How would that look?

What to expect in this article
The UK Equities Grandaddy ETF
Ticker: GDADDescription: The UK Equities Grandaddy ETF tracks the largest and most traded British firms from 1900 to 2025. From 1962 to the present, it follows the FTSE All-Share index which covers 98 % of the London Stock Exchange by market capitalisation. Index: Composite UK stock index / FTSE All-Share
Investment focus: Equity, UK
Total expense ratio: Cheap at the price
Replication: Physical
Legal structure: ETF
Strategy risk: Long only
Fund currency: GBP
Currency risk: Currency unhedged
Inception: 1 January 1900
Distribution policy: Accumulating
Fund domicile: UK
UK stock market growth of the UK Equities Grandaddy ETF
Maximum: +4,001,376.55 %Date: 31/12/2025, in % GBP
Cumulative total returns 1900-2025
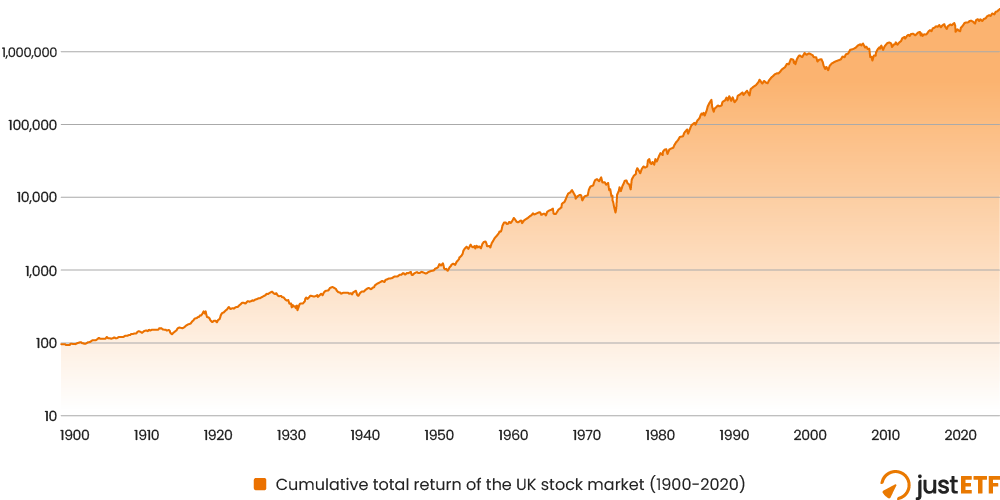
Source: justETF research, 09.05.2026. Nominal cumulative total returns in GBP.
Returns overview of the UK Equities Grandaddy ETF
| Years | Cumulative total return | Annualised total return |
|---|---|---|
| 1 | 24.02 % | 24.02 % |
| 3 | 46.51 % | 13.58 % |
| 5 | 73.94 % | 11.71 % |
| 10 | 123.44 % | 8.37 % |
| 15 | 199.01 % | 7.58 % |
| 20 | 283.86 % | 6.96 % |
| 25 | 328.32 % | 5.99 % |
| 30 | 720.97 % | 7.27 % |
| 35 | 1685.98 % | 8.58 % |
| 40 | 3230.01 % | 9.16 % |
| 45 | 9871.11 % | 10.77 % |
| 50 | 24217.68 % | 11.61 % |
| 100 | 1026233.23 % | 9.68 % |
| 126 years (MAX) | 4001376.55 % | 8.77 % |
Source: justETF research, 09/05/2026.
Total returns for every year 1900-2025 of the UK Equities Grandaddy ETF
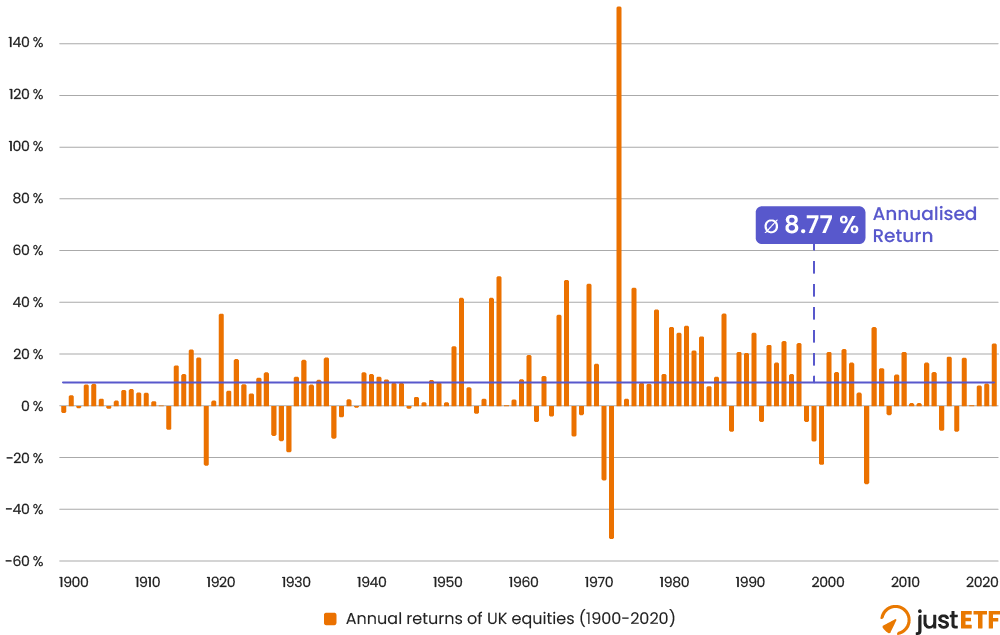
Source: justETF research, 09/05/2026. Annualised return is the average geometric rate of return across the entire time period.
Best and worst annual returns of the UK Equities Grandaddy ETF
| Year | Best annual returns | Year | Worst annual returns |
|---|---|---|---|
| 1975 | 154.51 % | 1974 | -51.51 % |
| 1959 | 50.28 % | 2008 | -29.93 % |
| 1968 | 48.59 % | 1973 | -28.56 % |
| 1971 | 47.21 % | 2002 | -22.68 % |
| 1977 | 45.48 % | 1920 | -22.63 % |
| 1954 | 41.75 % | 1931 | -17.75 % |
| 1958 | 41.55 % | 1930 | -13.42 % |
| 1980 | 37.19 % | 2001 | -13.29 % |
| 1989 | 35.52 % | 1937 | -12.33 % |
| 1922 | 35.48 % | 1969 | -11.83 % |
Source: justETF research, 09/05/2026.
Risk assessment of the UK Equities Grandaddy ETF
| Bear market start | Bear market end | Bear market duration | Max drawdown |
|---|---|---|---|
| 31/01/1920 | 31/10/1921 | 1y 9m | -31.08 % |
| 31/01/1929 | 30/06/1932 | 3y 5m | -45.27 % |
| 31/01/1937 | 31/07/1940 | 3y 6m | -25.57 % |
| 31/10/1951 | 30/06/1952 | 0y 8m | -21.33 % |
| 31/07/1957 | 28/02/1958 | 0y 7m | -20.14 % |
| 31/01/1969 | 31/05/1970 | 1y 4m | -30.00 % |
| 30/04/1972 | 30/11/1974 | 2y 7m | -66.36 % |
| 30/09/1987 | 30/11/1987 | 0y 2m | -33.60 % |
| 31/08/2000 | 31/01/2003 | 2y 5m | -42.92 % |
| 31/10/2007 | 28/02/2009 | 1y 4m | -41.09 % |
| 31/12/2019 | 31/03/2020 | 0y 3m | -25.13 % |
Source: justETF research, 09/05/2026. Max drawdown since inception: -66.36 % (1974)
High water mark chart of the UK Equities Grandaddy ETF
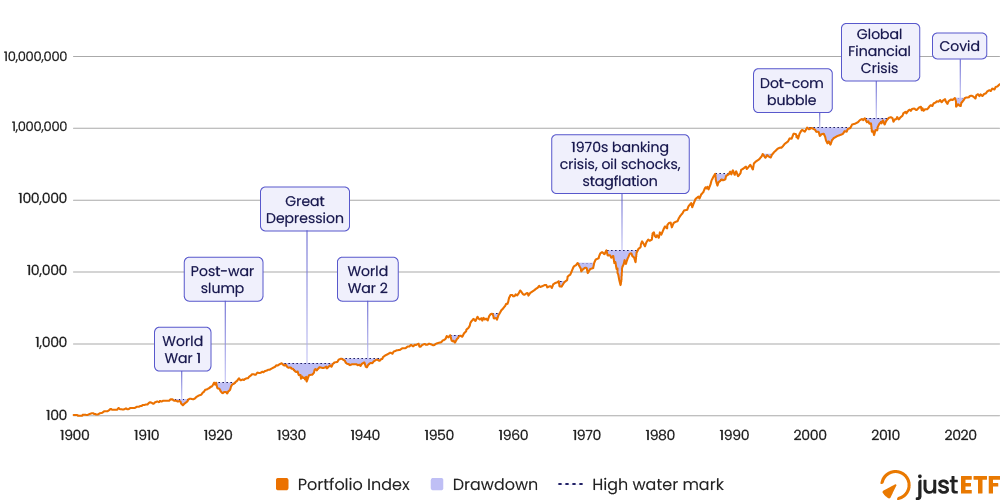
Source: justETF research, 09/05/2026.
Like all markets, the long-term growth of UK equities has been punctuated by periodic and, at times, severe drawdowns.
Drawdowns occur when a market falls below its previous peak, and end when a new high is reached. The length and depth of each drawdown is shaded in purple.
Risk overview of the UK Equities Grandaddy ETF
| Years | Volatility | Return per risk |
|---|---|---|
| 1 | 7.62 % | 3.15 |
| 3 | 9.00 % | 1.508 |
| 5 | 9.67 % | 1.21 |
| 10 | 11.83 % | 0.708 |
| 15 | 11.59 % | 0.654 |
| 20 | 13.01 % | 0.535 |
| 25 | 13.32 % | 0.45 |
| 30 | 13.33 % | 0.545 |
| 35 | 13.47 % | 0.637 |
| 40 | 14.71 % | 0.623 |
| 45 | 14.76 % | 0.729 |
| 50 | 15.33 % | 0.758 |
| 100 | 15.70 % | 0.616 |
| 126 years (MAX) | 14.29 % | 0.614 |
Source: justETF research, 09/05/2026.
Rolling 1 year volatility
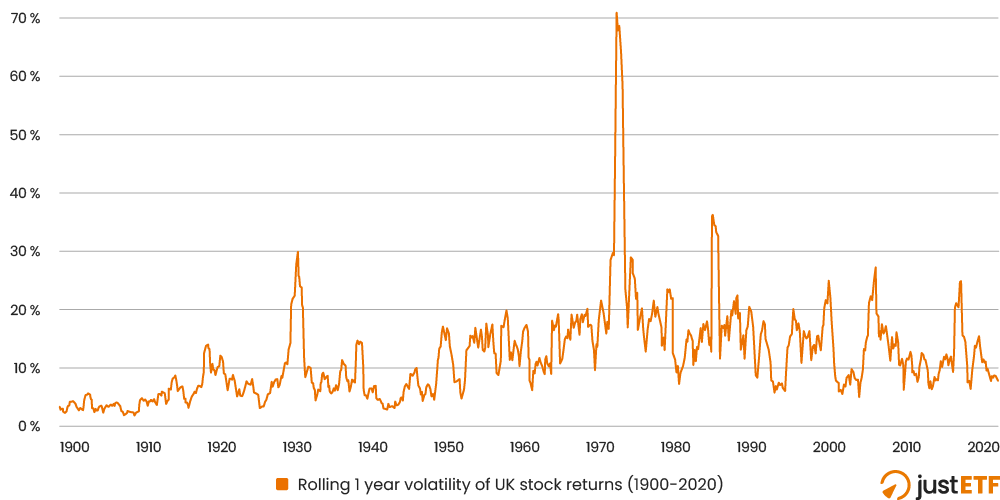
Source: justETF research, 09/05/2026.
Further information (as of 31/12/2025)
- Annualised return: 8.77 %
- Cumulative return: 4,001,376.55 %
- Volatility: 14.29 %
- Return per risk: 0.61
- Max drawdown: -66.36 % (November 1974)
- Longest drawdown: 7 years (January 1929 - January 1936)
Sources:
1900-1929 UK stock returns, Campbell G, Grossman R, Turner JD. (2021): Before the cult of equity: the British stock market, 1829–1929. European Review of Economic History. 25. 10.1093/ereh/heab003. 1930-1962 Composite UK stock index, Chadha J, Rincon-Aznar A, Srinivasan S, Thomas R. A Century of UK Economic Trends. ESCoE, NIESR and Bank of England. 1962-2018 FTSE All-Share index, A Century of UK Economic Trends. 2018-2025 FTSE All-Share index, FTSE Russell.


Search by topic
Articles by topic


