Withdrawal strategies are intended to minimise the two key risks that face everyone who relies upon their portfolio for retirement income:
Running out of money before you die.
Not spending enough while you’re alive.
A well-designed withdrawal strategy is vital because these two problems lie in direct conflict with each other:
Sell too many assets too soon and your retirement income becomes unsustainable.
Yet live too frugally and you’ll needlessly restrict the enjoyable retirement you could have had.
Balancing these risks is unquestionably challenging. That’s why many different withdrawal strategies have been proposed by retirement researchers and wealth management practitioners who grapple with the issue.
So which are the most important retirement spending strategies to know about? How do they deal with the issues inherent in spending down your wealth? Read on.
justETF FYI
The withdrawal strategies below can all be implemented using diversified ETF portfolios. Our worked examples do not include taxes or fees.
The 4 % rule (fixed real withdrawals)
The 4 % rule is a guideline for determining an initial sustainable withdrawal rate for your retirement portfolio.
It works like this:
Year 1 retirement income amounts to 4 % of your portfolio’s value upon withdrawal.
Year 2 income is year 1 income adjusted for annual inflation.
Year 3 income is year 2 income adjusted for annual inflation. And so on.
The net effect is that you consistently draw the same real terms income every year, preserving your income in the face of inflation. (That’s why this strategy is known as a fixed real withdrawal strategy).
Calculation example
Initial portfolio value: £ 600,000
Year 1: 4 % withdrawal = £ 24,000 (£ 2,000 per month)
Year 2 (inflation is 2 %): £ 24,000 x 1.02 = £ 24,480 (£ 2,040 per month)
Year 3 (inflation is 3.5 %): £ 24,480 x 1.035 = £ 25,337 (£ 2,111 per month)
Advantages
Simplicity: The 4 % rule is easy to remember and implement. This helps explain why it’s the best known withdrawal strategy.
Predictability: The strategy prioritises a consistent real-terms income above all else.
Historical reliability: In backtests, this strategy has worked in approximately 95 % of cases. The portfolio is often worth a significant sum upon death according to 30-year historical retirement simulations.
Disadvantages
Sequence of returns risk: The procedure above is applied regardless of portfolio value. That can spell trouble if the capital markets suffer a historically poor run of results.
In theory a naive retiree who blindly followed the 4 % rule could sell too much of their portfolio and run out of money.
In practice, people are typically more sensible than that and rein in their spending when times are tough. Still, the strategy doesn’t provide guidance on how and when to do so.
Sequence of returns risk 2 (The Upside): The 4 % rule was designed to cope with the worst historical 30 year returns generated by a 50/50 US stocks and bonds portfolio. But what if a retiree did not live through the unluckiest thirty years in American investment history? Then they could have withdrawn more than 4 % and enjoyed a better lifestyle.
The problem is that the 4 % rule doesn’t include a mechanic for spending more when returns are good. Which means some retirees can make their heirs very rich if they don’t adjust their spending upward.
Is 4 % too much or too little? The 4 % rule is based on a particular US stocks and bonds portfolio that’s intended to last no more than 30 years. It doesn’t account for global returns, longer retirements, different asset class combinations, or investment fees and taxes. Change a variable and you change the withdrawal rate percentage. Moreover, the sustainable withdrawal rate derived from historical returns can always be superseded by a worse series of events in your own lifetime.
So while the 4 % rule is a useful starting point, it’s highly conditional. It’s a great introduction to the factors retirees should think about, but it’s not a set-and-forget solution.
Variable withdrawal (fixed percentage)
This strategy aims to fix the risk of failure that comes with rigid applications of the 4 % rule.
Very simply, you withdraw a fixed percentage of your portfolio’s current value each year. For example, you might withdraw 4 % annually.
While the original 4 % rule means you’ll receive a fixed inflation-adjusted income (so long as your portfolio is large enough to fund it), a fixed percentage strategy means your income fluctuates in line with your portfolio’s performance.
If your portfolio grows 20 % in year one, then your next payout will be larger as you withdraw 4 % from your swollen account balance.
Of course, your income also shrinks if your portfolio contracts.
That’s why this strategy is known as ‘variable withdrawal’ - because your income isn’t fixed. Only the withdrawal rate percentage remains the same.
Using a fixed withdrawal percentage virtually eliminates the chance that you’ll ever run your portfolio down to zero - which is the critical difference between this method and the original 4 % rule.
The downside is you could be forced to tighten your belt painfully during a severe crisis.
Calculation example
Year 1 (portfolio value £ 600,000): 4 % fixed withdrawal = £ 24,000 (£ 2,000 per month)
Year 2 (portfolio value £ 500,000): 4 % fixed withdrawal = £ 20,000 (£ 1,666.67 per month)
Year 3 (portfolio value £ 700,000): 4 % fixed withdrawal = £ 28,000 (£ 2,333.33 per month)
Advantages
Low risk of bankruptcy: You only withdraw a modest percentage of your available funds thus preserving your portfolio for future years. During downturns, you automatically protect your portfolio by scaling your withdrawal to your remaining balance.
Simplicity: The strategy is very easy to understand.
Cut your cloth: Your income is allowed to rise during bull markets. You also spend less in downturns - protecting your portfolio from depletion.
Disadvantages
Income instability: Your annual income can fluctuate a great deal.
Downward spiral: Your payout can fall below the bare minimum you need if your portfolio suffers major losses. Consistently reducing withdrawals may lead to unacceptable spending cuts.
Dividend withdrawal strategy
This is the classic income investing strategy - you live off your dividends and interest, and never touch your capital. Your portfolio will almost certainly persist because you don’t sell your shares. Hence your investments can form an enduring legacy that may be passed on to the next generation.
It’s important to note, however, that because dividend distributions reduce share prices, living on your income is mathematically equivalent to selling a portion of your portfolio.
Essentially a dividend strategy is a variable withdrawal strategy. Your income changes from year to year and your withdrawal rate is defined by the dividend yield of your portfolio.
Psychologically a dividend strategy is very comforting to investors because their capital remains sacrosanct. But there’s no free lunch. It’s your withdrawal rate that determines your portfolio’s sustainability, not the withdrawal method.
Calculation example
Initial portfolio value: £ 600,000
Dividend yield: 3 % per year
Year 1 payout: 3 % withdrawal = £ 18,000 (£ 1,500 per month)
Later years: Income is whatever cash dividends and interest are generated by the portfolio. You never sell.
If the ETF’s underlying holdings generate more cash per share, your income goes up.
If they cut dividends, for example during a major financial crisis, your income goes down.
Note on yield: A rising yield doesn’t necessarily mean rising income. Yield is conventionally dividends paid over the last 12 months divided by the share price. Therefore yields can go up when prices fall. Following on from our previous example, if the portfolio’s value fell to £ 300,000 - while the yield increased to 5 % - your income would drop to £ 15,000 a year. Your income only holds steady if the actual cash dividends hold steady.
Advantages
Psychology: Some investors find it easier to remain calm in times of crisis because they have committed to not selling their shares.
Low probability of failure: It’s hard to go bankrupt when you don’t sell. And by investing in diversified ETFs, you make it exceedingly unlikely that your portfolio will be ruined by every holding going bust - the danger with traditional stock-picking dividend strategies.
Inflation protection: Historically, dividend growth in a globally diversified ETF portfolio has typically exceeded inflation in the long term. However, dividend strategies aren’t always good inflation hedges over shorter periods.
You know exactly what you can spend: Dividends and interest are fair game. Shares are left alone. It’s that simple.
Disadvantages
Dividend cuts: Your income isn’t stable because companies can reduce or eliminate dividends during hard times. In a crisis that can push consumption unacceptably low. Some people hold a cash buffer to smooth out their otherwise variable dividend income.
Underspending: Relying on dividend income alone leaves your portfolio’s capital gains untapped. That normally means having to accumulate a larger portfolio to secure the same income as other retirement strategies. You may also live more frugally than you intended, depending on the future path of dividend rates.
Reaching for yield: Chasing a high yield can push dividend investors towards a narrow set of sectors (banks, energy, utilities, tobacco, property) and away from the broader market. Very high yields are often a warning sign: the price has fallen because the market expects a cut. These are known as “yield traps.”
Ignoring buybacks: Many companies, especially in the US, return cash to shareholders by buying back shares instead of paying dividends. A dividend-focused approach underweights those firms, even though buybacks deliver value to shareholders in a similar way.
Tax disadvantages: Dividends are taxed more heavily than share sales in many countries. That’s one reason why US firms prefer to return money to shareholders via buybacks.
Bucket strategy
The bucket strategy divides your retirement assets into separate pots that are matched with your immediate spending needs, the medium-term, and your long-term horizon. The idea is to balance your pressing income requirements against long-run growth.
A typical bucket strategy looks like this:
Bucket 1 (short term, roughly years 1-3 of spending): Cash and cash-like holdings such as savings accounts or money market funds. This covers near-term living costs with low volatility assets, so you aren’t forced to sell equities when they’re in retreat.
Bucket 2 (medium term, roughly years 4-10 of spending): Government bonds and other lower volatility assets. These aim to beat cash while staying relatively stable.
Bucket 3 (long term, remaining assets): Mostly equities. This pot is meant to grow and replenish the other buckets when needed. Critically, Bucket 3 can be left alone for up to a decade, so you don’t have to liquidate stocks when they’re down.
Calculation example
Pot 1 (cash): £ 72,000 - covers 1-3 years of spending.
Pot 2 (short to intermediate bonds): £ 168,000 - covers years 4-10.
Pot 3 (equities): £ 360,000 - covers long-term growth.
You periodically refill the buckets. Bucket 1 is replenished from Bucket 2, and Bucket 3 gains are harvested for Bucket 2.
Because buckets 1 and 2 form a ten-year spending buffer, you can pause the rebalancing process for a while if stocks are under pressure.
Equally, if stocks have a great year then you can take the opportunity to top up the other two buckets directly from Bucket 3.
Note that withdrawals should be adjusted by annual inflation to maintain your purchasing power.
Advantages
Psychology: Many retirees draw great comfort from having money in the bank. Their spending reserve makes it much easier to tolerate market falls.
Avoiding forced sales: You don't have to sell shares when prices are at rock bottom. This significantly reduces sequence of returns risk.
Structure: The bucket system is intuitive and provides a clear rationale for ownership of each asset class.
Disadvantages
Cash drag: Bucket strategies encourage larger cash positions than normal. Cash has historically lagged bonds over the long-term, which potentially reduces the returns you might otherwise have enjoyed.
False sense of security: The cash bucket feels safe, but the total portfolio carries exactly the same risk as its overall allocation. As with the dividend strategy, your portfolio’s sustainability depends on how much you take out (and how quickly) not upon the labels applied.
Vague: Bucket strategies often don’t strictly define a suitable withdrawal rate, rebalancing timings, inflation-adjustment mechanism, or ongoing asset allocation. Retirees are more likely to run adrift unless those elements of their strategy are nailed down.
Buffers can run out: Even 10 years of spending reserves may not be enough to prevent equity sales at a loss during very long economic slumps.
The Floor & Ceiling framework is a flexible middle ground between the 4 % rule and fixed percentage approaches.
Each year you withdraw a fixed percentage of your portfolio’s current value.
That means your income can rise during a bull market and fall during a bear market.
Happily the floor and ceiling rules step in to take the edge off wild income fluctuations.
The floor cushions income drops.
The ceiling caps how much you can spend.
The goal is to maintain a balance between a good standard of living and long-term capital protection.
The risk of spending too much is curtailed by the ceiling while the risk of years of austerity is mitigated by the floor.
Calculation example
Initial portfolio value: £ 600,000
Year 1: 4 % withdrawal = £ 24,000 (£ 2,000 per month)
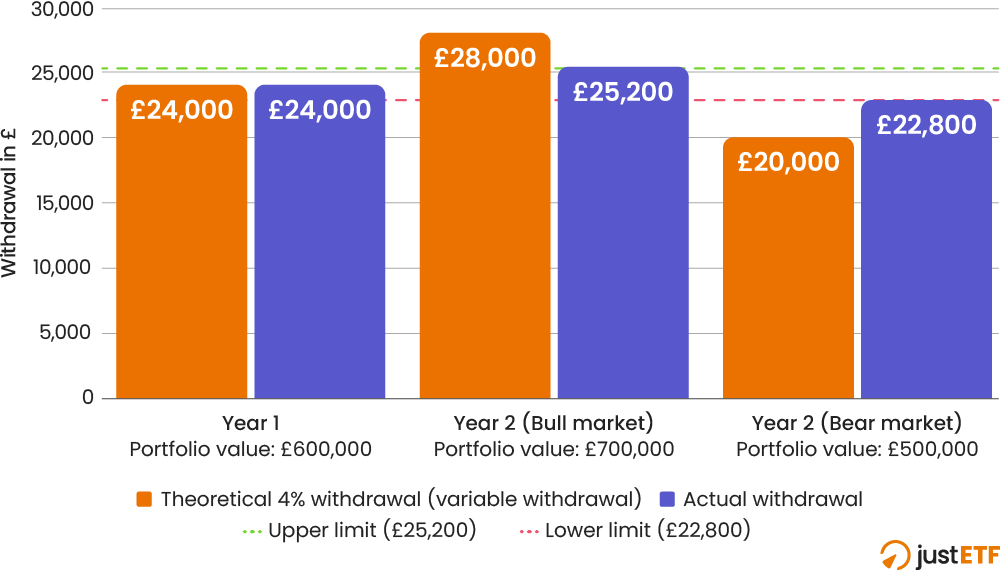
Floor and ceiling limits: +/- 5 % of the initial withdrawal amount
Minimum income (Floor): £ 22,800 per year
Maximum income (Ceiling): £ 25,200 per year
Scenario 1 (Bull market): After the first year, the portfolio is worth £ 700,000. The 4 % fixed percentage withdrawal rate would ordinarily mean you could spend £ 28,000 in year 2. However, the ceiling mechanism caps that spend at £ 25,200. The remaining £ 2,800 is kept invested and so continues to grow your wealth within the portfolio.
Scenario 2 (Bear market): Portfolio value is £ 500,000 after year one. This time the 4 % withdrawal rate indicates a year two income of £ 20,000. Luckily though, the floor softens the fall by allowing you to spend £ 22,800. The extra £ 2,800 represents a controlled risk within a pre-defined range of flexibility. Extreme budget cuts are averted.
Floor & Ceiling strategy: Withdrawals comparison
Source: justETF Research; 02/26/2026
To maintain your purchasing power, increase the base income allowed by the annual rate of inflation. Then derive your floor and ceiling limits from that new figure.
For example, the inflation-adjusted floor and ceiling in year 2 of the example above would be:
Year 1 base income: £ 24,000
Year 1 inflation: 3 %
Floor and ceiling: +/- 5 % of inflation-adjusted base income
Year 2 base income: £ 24,720 (£ 24,000 x 1.03)
Year 2 minimum income (Floor): £ 23,484 per year (£ 24,720 x 0.95)
Year 2 maximum income (Ceiling): £ 25,956 per year (£ 24,720 x 1.05)
Base income rises with inflation each year, regardless of how much you actually withdrew. So the year 3 base would be £ 24,720 increased by that year’s inflation rate, even if the floor or ceiling changed your actual year 2 withdrawal.
Advantages
Sequence of returns risk: The income reduction mechanism makes this strategy slightly safer than the 4 % rule. Although the floor feature means it’s not as safe as the variable withdrawal strategy.
Predictable income: In this version of the Floor & Ceiling, your income never falls more than 5 % below its inflation-adjusted starting level, or rises more than 5 % above it. You know the range of your real-terms income in advance, which makes budgeting almost as easy as with the 4 % rule.
Good years strengthen your portfolio: When markets do well, the ceiling keeps any income above it invested. That builds a buffer that can help carry the portfolio through later downturns.
Disadvantages
Limited protection in a severe crash: The floor is fixed, so it doesn’t fall with your portfolio. If your portfolio plummets and stays down, you keep withdrawing close to your original income. For example, the £ 22,800 floor is 11.4 % of a £ 200,000 portfolio. A deep, prolonged slump can still exhaust your savings.
You may underspend: Because the ceiling caps your income at 5 % above its starting level, long bull markets can leave large gains unspent.
The band width decides almost everything: With a +/- 5 % band, the strategy behaves much like the 4 % rule. A lower floor offers better protection against depletion, and a higher ceiling lets you enjoy more of the upside, but both make your income less stable. There’s no standard setting, so you need to choose a band that fits how much you can realistically cut back.
The Guyton & Klinger method is one of the best known dynamic withdrawal strategies.
The strategy’s authors, Jonathan Guyton and William Klinger, claimed that their guardrails system allowed for a higher initial withdrawal rate (circa 5 %) than the standard 4 % rule.
The quid pro quo is that you must be prepared to cut income during market downturns.
The main Guyton & Klinger rules are:
Withdrawal rule: Increase spending by inflation each year, except after a year in which the portfolio had a negative return and your current withdrawal rate is above your initial rate. Then you skip the increase, and you don’t make it up later.
Capital preservation rule (guardrail 1): If your current withdrawal rate rises more than 20 % above your initial withdrawal rate, cut spending by 10 %.
Prosperity rule (guardrail 2): If your current withdrawal rate falls more than 20 % below your initial rate, raise spending by 10 %.
Portfolio management rule: Fund withdrawals from whichever asset classes are overweight, and avoid selling equities after a down year.
Longevity: Don’t impose the capital preservation rule in the final 15 years of a planned retirement.
The capital preservation and prosperity rules ensure that spending is curbed during lean years while you can splurge in boom times.
Calculation example
Initial portfolio value: £ 600,000
Year 1: 4 % withdrawal = £ 24,000 (£ 2,000 per month)
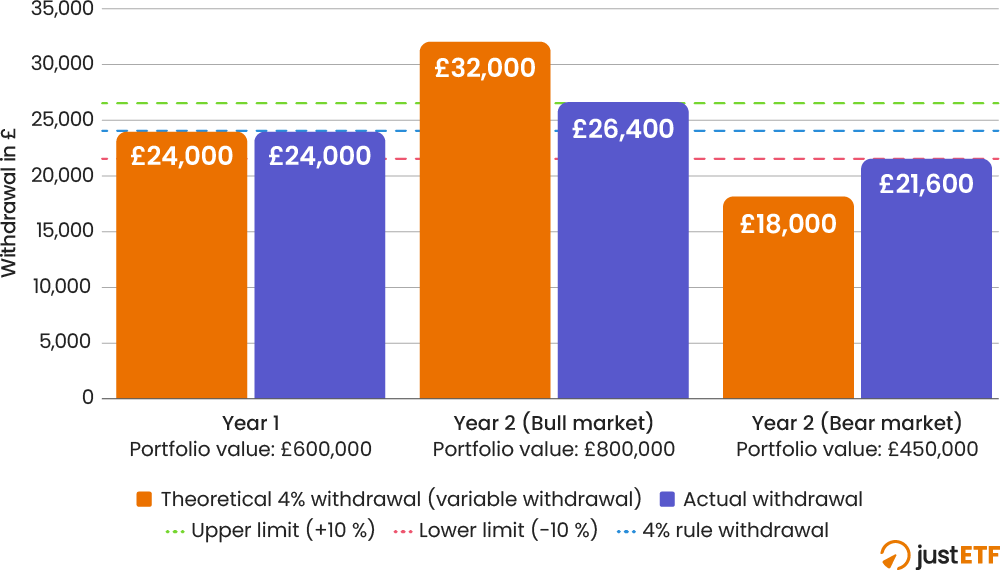
Guardrails activate: +/- 20 % of the initial withdrawal rate
Capital preservation rule: Current withdrawal rate over 4.8 % = cut spending by 10 %
Prosperity rule: Current withdrawal rate under 3.2 % = increase spending by 10 %
Scenario 1 (Bull market): The portfolio value rises to £ 800,000. Assuming inflation is 0 %, a £ 24,000 withdrawal amounts to a 3 % current withdrawal rate. The prosperity rule kicks in when withdrawals fall below 3.2 %, so it’s time for a pay rise! You can increase your spending by 10 % to £ 26,400.
Scenario 2 (Bear market): The portfolio crashes to £ 450,000. Once again inflation is mysteriously absent. All the same, the previous withdrawal of £ 24,000 pushes the current withdrawal rate to 5.33 % of the portfolio’s value. The capital preservation alarm rings at 4.8 % so it’s time to slash spending. This year’s annual withdrawal must be reduced by 10 % to £ 21,600.
Guardrails strategy: Withdrawals comparison
Source: justETF Research; 05/05/2026
Advantages
Higher initial withdrawal rate: Because spending adjusts when markets move sharply, you can typically start above the 4 % rule, often around 5 % in the research, and spend more in the early, usually more active, years of retirement.
Clear rules: The triggers and adjustments are set in advance, so decisions are mechanical rather than emotional. That reduces the risk of panic cuts or overspending.
Spending rises in strong markets: The prosperity rule lets income grow when the portfolio performs well, helping to address the underspending problem that can afflict the 4 % rule.
Disadvantages
Painful cuts: In a prolonged bear market, successive 10 % spending reductions plus skipped inflation increases can reduce real income substantially.
Willpower: Actually imposing the required pay cuts demands a high degree of discipline so as not to jeopardise the long-term sustainability of the portfolio.
Sensitive to short-term market moves: Because triggers depend on the current portfolio value, a sharp but brief fall can force a cut that turns out to be unnecessary once markets recover.
The table above shows that no single withdrawal strategy excels in every dimension of retirement income management.
Every method has advantages and disadvantages, so the important question is which system is best suited to your needs?
The 4 % rule’s strength is stable real-terms payouts but its inflexibility means adherents risk either spending too much (potentially ending in portfolio failure) or too little (resulting in withdrawal inefficiency and very grateful heirs). Its many caveats are also little known so please check them out before adopting this strategy. (We listed the main ones above.)
Variable withdrawal rates by contrast mostly solve the portfolio failure and withdrawal efficiency problems. But the drawback is that your annual income will be all over the place.
The dividend strategy is popular because it makes people feel safe by prioritising capital conservation. Yet it typically also requires an oversized portfolio (relative to other methods) and performs poorly in terms of income consistency and withdrawal efficiency.
The bucket strategy is a hybrid blend of the dividend strategy’s reassuring psychology and the 4 % rule’s total return approach. Essentially, the bucket approach carries the same risks as the 4 % rule, depending on the initial withdrawal rate you choose, and is potentially slightly riskier because it’s more susceptible to cash drag.
The dynamic withdrawal rate strategies (Floor & Ceiling and Guardrails) are more advanced attempts to balance conflicting retirement spending objectives.
They’re a little more complex to run but if you can handle that then the big question becomes: are you prepared to reduce spending when the rules demand it, so you can more safely raise consumption when the markets are favourable?
Ultimately, your choice of withdrawal strategy is a highly personal decision. Much depends on how flexible you can be with spending, not to mention your tolerance of market turbulence.
Remember that - above all - the best plan is the one you can stick to.