
Votre sélection est vide.
Sélectionnez des ETF pour les comparer les uns aux autres.
Ajoutez un ETF à la sélection en le sélectionnant dans le sélecteur d’ETF ou sous « Comparer » sous le profil de l’ETF.
Like with gold, an investment in silver is easily done with listed products like ETFs or ETCs. These investment products track the spot silver price closely, after taking management fees into account. Silver has a significantly lower specific weight and features a lower cost per unit than gold. Therefore, an investment via an ETF or ETC, as opposed to owning the precious metal physically, is even more advantageous for silver.
For investors, however, silver is usually only the second choice. This is because silver is less scarce and used much more for industrial purposes, compared to gold. Therefore, the silver price is a lot more sensitive to economic fluctuations and the associated risk is considerably higher than for gold, at times even higher than for shares.
Besides exchange-traded products on silver in US dollar, there are currency-hedged products available as well. These products are also considered in our comparison. Currently, silver is tracked by 7 ETFs and/or ETCs.
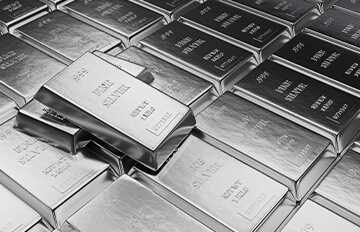
The diversification principles of the regulatory investment fund framework (UCITS) do not allow to launch a UCITS fund with only one constituent. Due to this fact, silver is mainly available as an exchange-traded commodity (ETC) in European countries. These products are certificates issued by a financial institution collateralised with physical silver. In contrast to the EU, Swiss regulation allows ETFs for single commodities like silver.
Source: justETF.com; As of 11.10.26; Performance in EUR, based on the largest ETC.
The total expense ratio (TER) of Silver ETCs is between 0,45% p.a. and 0,75% p.a.. These costs contain insurance premium, storage costs and additional management fees for the product.
| 1 | UBS ETF (CH) Silver (USD) A-dis | 35,38% | ||
| 2 | Swisscanto (CH) Silver ETF EA CHF | 33,45% | ||
| 3 | Swisscanto (CH) Silver ETF EA EUR | 33,16% |
Classement de tous les $rankingLink en fonction de leur rendement
| 1 | Swisscanto (CH) Silver ETF EA CHF | 2 361 M | ||
| 2 | Swisscanto (CH) Silver ETF EA USD | 1 004 M | ||
| 3 | Swisscanto (CH) Silver ETF EA EUR | 598 M |
Classement de tous les $rankingLink en fonction du volume du fonds
| 1 | UBS ETF (CH) Silver (USD) A-dis | 0,45% p.a. | ||
| 2 | Swisscanto (CH) Silver ETF EA CHF | 0,60% p.a. | ||
| 3 | Swisscanto (CH) Silver ETF EA EUR | 0,60% p.a. |
Classement de tous les $rankingLink en fonction des frais totaux sur encours
Pour la sélection d’un Silver ETF/ETC, outre les performances, d’autres facteurs jouent un rôle important lors de la décision. Pour faciliter la comparaison, vous trouverez une liste de tous les Silver ETFs/ETCs avec les indications relatives à la taille, aux coûts, à la couverture de change, au type de titres et aux garanties classée en fonction de la taille des fonds.
Comparaison détaillée de tous les $rankingLink
Comparaison graphique de tous les $rankingLink
| ETF ISIN | Taille fonds en M EUR | Frais en % | Couverture de change | Type de titres | Méthode de réplication | |
|---|---|---|---|---|---|---|
| Swisscanto (CH) Silver ETF EA CHFCH0183135976 | 2 361 | 0,60% p.a. | - | ETF | Physiquement garanti | |
| Swisscanto (CH) Silver ETF EA USDCH0183136008 | 1 004 | 0,60% p.a. | - | ETF | Physiquement garanti | |
| Swisscanto (CH) Silver ETF EA EURCH0183135992 | 598 | 0,60% p.a. | - | ETF | Physiquement garanti | |
| Swisscanto (CH) Silver ETF EAH CHFCH0183136024 | 499 | 0,60% p.a. | Oui (en CHF) | ETF | Physiquement garanti | |
| UBS ETF (CH) Silver (USD) A-disCH0118929048 | 489 | 0,45% p.a. | - | ETF | Physiquement garanti | |
| Xtrackers Physical Silver EUR Hedged ETCDE000A1EK0J7 | 275 | 0,75% p.a. | Oui (en EUR) | ETC | Physiquement garanti | |
| Swisscanto (CH) Silver ETF EAH EURCH0183136040 | 93 | 0,60% p.a. | Oui (en EUR) | ETF | Physiquement garanti |
Source : justETF.com ; situation au : 11.10.26
Le tableau suivant compare les performances de tous les produits a Silver ETF or ETC. Toutes les indications relatives aux performances sont données à la fin du mois et comprennent les distributions. Outre les performances à une date de référence, l’évolution dans le temps est décisive pour la comparaison des Silver. Pour cela, servez-vous aussi de nos comparaisons graphiques.
| ETF/ETC | 1 mois en % | 3 mois en % | 6 mois en % | 1 an en % | 3 ans en % | |
|---|---|---|---|---|---|---|
| UBS ETF (CH) Silver (USD) A-dis | -11,41% | 3,53% | -13,39% | 35,38% | 142,27% | |
| Swisscanto (CH) Silver ETF EA CHF | -7,01% | 3,72% | -13,04% | 33,45% | 148,87% | |
| Swisscanto (CH) Silver ETF EA EUR | -6,92% | 3,64% | -13,24% | 33,16% | 149,13% | |
| Swisscanto (CH) Silver ETF EA USD | -6,72% | 3,32% | -13,07% | 33,09% | 149,35% | |
| Xtrackers Physical Silver EUR Hedged ETC | -12,60% | 2,52% | -15,81% | 26,05% | 136,99% | |
| Swisscanto (CH) Silver ETF EAH EUR | -9,19% | 2,34% | -15,44% | 24,00% | 144,61% | |
| Swisscanto (CH) Silver ETF EAH CHF | -10,54% | -1,13% | -19,13% | 19,01% | 132,03% |
| ETF/ETC | 2026 en % | 2025 en % | 2024 en % | 2023 en % | 2022 en % | |
|---|---|---|---|---|---|---|
| Swisscanto (CH) Silver ETF EA CHF | -13,11% | 117,73% | 27,84% | -4,53% | 8,76% | |
| Swisscanto (CH) Silver ETF EA USD | -13,18% | 117,94% | 28,34% | -4,73% | 8,40% | |
| Swisscanto (CH) Silver ETF EA EUR | -13,25% | 117,32% | 28,72% | -4,64% | 8,78% | |
| UBS ETF (CH) Silver (USD) A-dis | -16,26% | 124,65% | 28,67% | -3,02% | 9,41% | |
| Swisscanto (CH) Silver ETF EAH EUR | -18,53% | 139,23% | 18,09% | -4,34% | -0,90% | |
| Swisscanto (CH) Silver ETF EAH CHF | -21,69% | 136,59% | 13,49% | -0,36% | 3,42% | |
| Xtrackers Physical Silver EUR Hedged ETC | -22,82% | 141,00% | 18,17% | -4,26% | -0,23% |
Source : justETF.com ; situation au : 30.09.26 ; indications en EUR, distributions comprises