Imagine you're choosing between two ETFs. Both returned 10 % last year. Both increased your wealth by the same amount.
Yet they took two very different paths to get there.
ETF A climbed steadily, month after month, with only minor dips along the way.
ETF B, by contrast, lurched all over the place. One month it was up 8 %, the next it was down 6 %.
Would you rather own ETF A or ETF B?
Most people would prefer a smooth ascent versus a stop-start investment that always seems like three steps forward and two steps back.
That’s where risk-adjusted returns come into play. It’s a metric with something to say about how owning an investment feels.
Is it relatively gentle or bumpy as blazes? How much risk did you have to take before arriving at your destination?
That’s what a risk-adjusted return seeks to measure.
Or to put it another way: it’s the bang-for-your-buck metric. It helps you identify which ETFs delivered the most gain for the least pain.
What "risk-adjusted" actually means
A risk-adjusted return is a return measured against the amount of risk that produced it. Instead of just asking "what did this investment return?", it asks "how much return did I earn per unit of risk taken?"
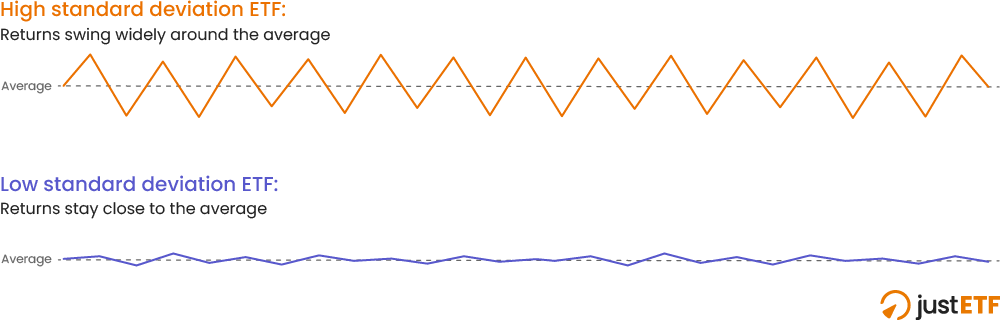
The most common proxy for risk is volatility as measured by standard deviation. Standard deviation captures how much an investment's return bounces around its average - as illustrated in the diagram below:
An ETF with a high standard deviation often trends much higher and lower than its average return.
While an investment with a low standard deviation moves more predictably.
Classic examples of volatile investments include most stock market ETFs, gold ETCs, and commodity ETFs when viewed over any significant timeframe.
Low standard deviation investments are typified by money market ETFs and ultra-short bond ETFs. These vehicles rarely win big or lose big - hence they feel comparatively stable.
Return per risk
So we have our raw return number and we have our measure of risk (standard deviation). Put them together and we get return per risk.
Return per risk is the risk-adjusted return metric we use at justETF. It’s simple to calculate:
Return per risk = Annualised return / Standard deviation
Dividing return by standard deviation tells you how much return you got per unit of volatility during the time frame in question.
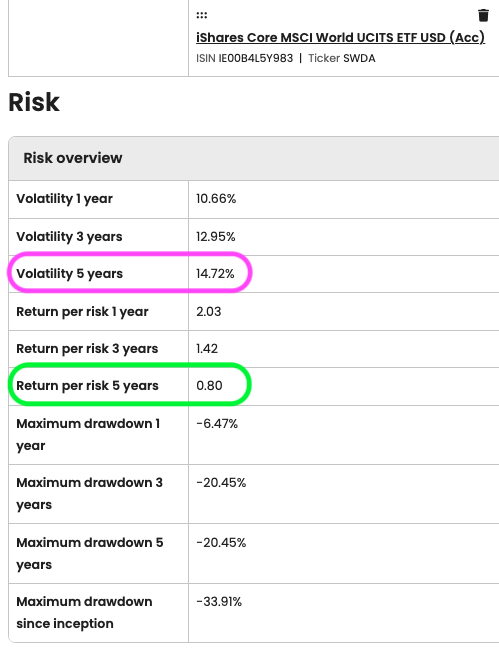
For example, we can calculate the 5-year return per risk figure for the World equities ETF, SWDA, as follows:
5-year annualised return = 11.83 %
5-year volatility = 14.72 %
5-year return per risk = 0.8 (11.83 / 14.72)
Of course, you don’t need to calculate the numbers yourself. We do that for you in the Risk overview section on every ETF profile page:
Risk of the MSCI World
Source: justETF, ETF Profile iShares Core MSCI World
You can also find each ETF’s annualised return by tapping Compare on its profile page > Compare selection in detail > Chart comparison > Risk-Return tab.
Other risk-adjusted return metrics are available. The Sharpe ratio is the best known and very similar to return per risk in practice.
The question is: what do you do with these numbers? Is 0.8 good or bad? Let’s add some context!
How to use risk-adjusted returns
A single risk-adjusted return means little by itself. But the return per risk metric is very useful when you compare multiple ETFs:
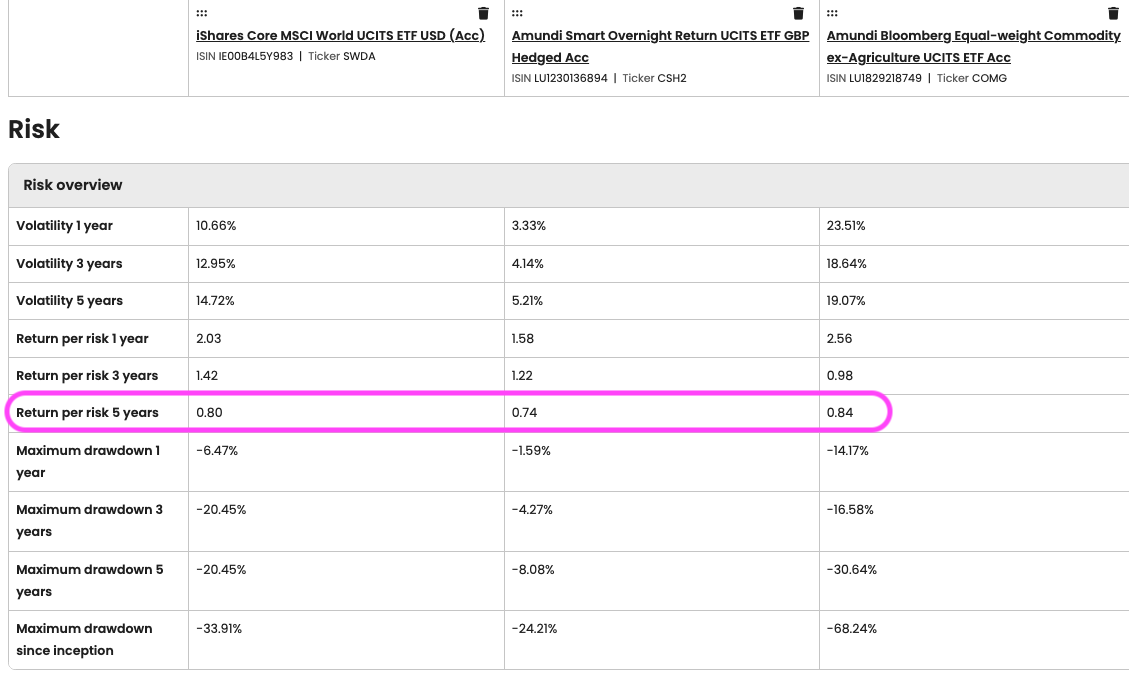
5-year comparison of risk-adjusted returns for different asset classes
COMG = Broad commodities, CSH2 = Money market, SWDA = World equities. 5-year comparison: 28 August 2021 to 28 August 2026, EUR.
The 5-year return per risk scores are similar for all three investments - though a money market ETF is a very different experience from commodities or World equities.
Essentially the highest score is best. On this view, the commodities ETF has the edge. In risk-adjusted terms, it’s generated the most return relative to volatility incurred over the last five years.
To make this clearer, let’s line-up the key 5-year metrics together:
Asset class
Annualised return (%)
Volatility (%)
Return per risk
World equities
11.83 %
14.72 %
0.8
Money market
3.88 %
5.21 %
0.74
Commodities
16.03 %
19.07 %
0.84
Money market is the surprise package here. A naive investor would just look at the raw returns and think the money market ETF has been terrible.
But while CSH2 won’t make you rich, it doesn’t soar and swoop like a drunken rocket ship pilot either.
You can see that in the low 5.21 % volatility figure.
The upshot is that the money market ETF punched its weight against the other two on a 5-year risk-adjusted basis.
In truth, there’s little to choose between the three if you care about risk as well as return.
The money market ETF has been low risk and low reward. While the equities and commodities vehicles have been high reward and relatively high risk.
In other words, all three ETFs have earned their place in a diversified, well-balanced portfolio.
justETF FYI: Risk in this sense means volatility. Moreover, volatility tracks an investment’s upswings as well as its downswings. This is one of the limitations of the metric as most people are just fine with a 50 % gain but are less keen on a 50 % loss.
Risky business
No metric is perfect but risk-adjusted returns are always worth an eyeball for a more nuanced take on an ETF’s track record.
The larger your pot grows, the larger risk will loom in your thoughts, so it’s worth getting to grips with the indicators as early as possible. Just remember:
High risk-adjusted scores are better.
Prioritise longer timeframes over more changeable short-term views.
There aren’t threshold scores that signal “Must have” or “Total loser”.
Comparisons are relative and change depending on the investments considered, time period chosen, and recent market conditions.
Sometimes the flashier headline return is genuinely the better choice. Often, once you adjust for risk, it isn't.


 An ETF with a high standard deviation often trends much higher and lower than its average return.
While an investment with a low standard deviation moves more predictably.
Classic examples of volatile investments include most stock market ETFs, gold ETCs, and commodity ETFs when viewed over any significant timeframe.
Low standard deviation investments are typified by money market ETFs and ultra-short bond ETFs. These vehicles rarely win big or lose big - hence they feel comparatively stable.
An ETF with a high standard deviation often trends much higher and lower than its average return.
While an investment with a low standard deviation moves more predictably.
Classic examples of volatile investments include most stock market ETFs, gold ETCs, and commodity ETFs when viewed over any significant timeframe.
Low standard deviation investments are typified by money market ETFs and ultra-short bond ETFs. These vehicles rarely win big or lose big - hence they feel comparatively stable.