The major factors that can alter an ETF’s return or performance calculation include:
- How distributions are treated
- What time of day the price was taken
- Subtle variations in time periods, e.g. the definition of a year
- Which currency is being used
- Currency conversion methodology
- How distributions are treated
- What time of day the price was taken
- Subtle variations in time periods, e.g. the definition of a year
- Which currency is being used
- Currency conversion methodology
- How distributions are treated
- What time of day the price was taken
- Subtle variations in time periods, e.g. the definition of a year
- Which currency is being used
- Currency conversion methodology
Small differences in these factors can cause large discrepancies in the performance of an ETF. It can be like comparing the speed of Formula One cars without knowing which are being clocked in miles per hour and which are using kilometres per hour.
So let’s take each factor in turn and show you what to look out for.
Performance treatment of distributions: addition vs. reinvestment
It can be difficult to compare the returns of a distributing ETF versus an accumulating (or capitalising) one. A distributing ETF pays out all dividends or interest, while an accumulating ETF reinvests that income back into the fund - so the investor automatically benefits from compounding returns (you earn interest on your interest).
Without an adjustment, an accumulating ETF will appear to grow faster than a distributing ETF that doesn’t reinvest income.
Distributing or Accumulating ETFs?
You have the choice between ETFs that regularly distribute income and those that reinvest income on their own. We tell you what matters when making your decision.
Read more about Distributing or Accumulating ETFs
The most common method of ensuring a fair comparison between distributing and accumulating ETFs is to assume all distributions are reinvested back into the ETF.
This way you can compare the growth of both types of ETF on a total return basis: including any capital appreciation plus the compounding effect of income being invested in new shares of the fund.
justETF uses the reinvestment method and assumes that all distributions are rolled back up into the ETF on the ex-dividend date.
What is the ex-dividend date?
The price of an ETF is reduced by the amount of its forthcoming distribution on the ex-dividend date. This is to ensure a fair price for investors who won’t qualify to receive the dividend if they buy into the ETF on or after the ex-dividend date. A seller doesn’t receive the dividend either if they sell before the ex-dividend date. The distribution is actually paid on the payment date. This date will usually occur several days, or occasionally a few weeks, after the ex-dividend date.
An alternative method is to add the value of the distributions to an ETF’s price instead of reinvesting them. Distributions treated this way don’t count as producing further income, and so the powerful compound effect is sheared off from the ETF’s track record.
This can lead to a wide performance gap over time between the two methods, especially in growing markets.
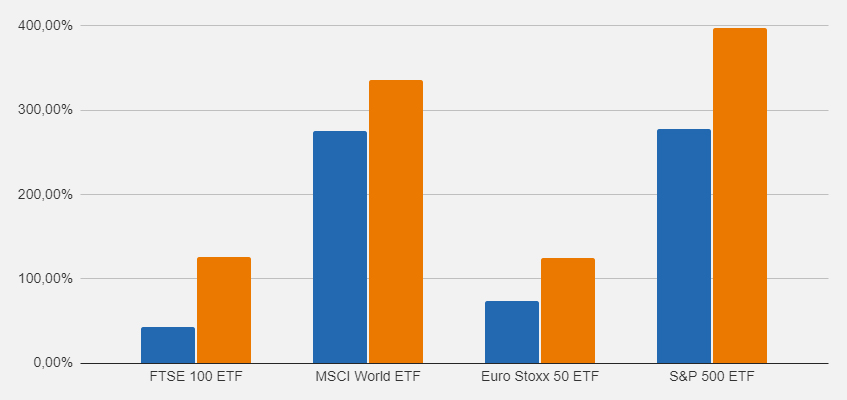
Return differences in distributing ETFs caused by the calculation method
![Return differences in distributing ETFs caused by the calculation method]()
Return with added dividends Return with reinvested dividends
Source: justETF Research; as of 30/06/2021, performance since the inception of the respective ETF
Some websites don’t take distributions into account at all. They only track the capital appreciation of an ETF (known as the price return) and completely fail to show the impact that income has on performance.
Price time and the source may differ
The price of an ETF fluctuates constantly as it trades, but its performance is measured by a single price taken at a particular time during the day.
Naturally, performance changes depending on when that snapshot is taken.
The official worth of an ETF is published once a day by the ETF provider and is known as the NAV (Net Asset Value). However, the closing price on a stock exchange may be quite different.
Therefore, it’s vital to know whether you are looking at the published NAV or the stock exchange price and at what time the price was taken.
The London Stock Exchange closes at 4:30 pm (GMT) while the New York Stock Exchange closes at 9 pm (GMT). Four and a half hours is plenty of time for an ETF’s price to change. Even if the ETF is not traded anymore on the LSE, underlying stocks may still be traded at a different exchange around the globe and impact the price of an ETF.
justETF uses NAV, as far as possible, to calculate performance. However, since the NAV is sometimes published with a delay by the ETF provider, justETF uses stock market closing prices to "bridge" any missing days. To do pure NAV comparisons, use end-of-month values in comparisons.
justETF tip: Learn how to analyse the performance of your portfolio in the
Premium version of justETF in our
tutorial.
Currency and exchange rates matter
Performance can be presented in an ETF’s trading currency, fund currency, or in the home currency of the investor. Of course, UK investors care about the return in pounds, but websites that focus on NAV will often report in the fund currency.
justETF always displays performance in the investor’s home currency, and it’s also possible to switch between GBP, USD, CHF, or EUR. Learn more about how
currency rates affect performance.
Even when performance is converted into your home currency, metrics can deviate depending on which currency exchange rate is used.
For example, justETF and many other websites use the official ECB exchange rate set at 1.15 pm (GMT) / 2.15 pm (CET). However, the Reuters’ 4 pm CET rate is also widely used.
And because different exchange rates set at different times result in different prices, you end up with an apple to orange comparison.
Time period lengths and definitions are inconsistent
You might think we can all agree on what a year is, but creative differences exist even here.
Many websites offer to display the last calendar year or rolling periods of three and five years, but performance comparisons only work if the start and end dates are consistent.
The starting date of a year is particularly troublesome as some define it as the last banking day of the previous year while others plump for the first banking day of the year. In the latter case, the value of the first day is over-emphasised, as the NAV is usually calculated at the end of the day.
To remove any doubt, look for a website that clearly displays the dates covered by the performance period you’re interested in.
justETF tip: You will always find the precise start and end date displayed above all justETF charts - on the right-hand side. You can also check the NAV on any given date by hovering your mouse along the ETF’s performance chart.
Price return charts versus total return charts
Finally, watch out for whether you’re being shown a price return or a total return chart. A price return chart reveals historical buying prices, but discards the distributions side of performance.
A total return chart assumes all distributions are reinvested and gives the complete performance picture.
Checklist: What to look out for when comparing ETF performance
Here’s a quick summary of the important factors when comparing the performance of an ETF on different sites: