Your selection basket is empty.
Define a selection of ETFs which you would like to compare.
Add an ETF by clicking "Compare" on an ETF profile or by checkmarking an ETF in the ETF search.
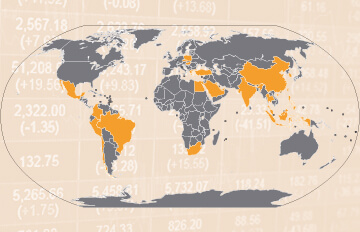
The MSCI Emerging Markets is an international equity index which tracks stocks from 24 emerging market countries. With 1,178 constituents (as of 30/06/2026), the index covers approximately 85% of the free float-adjusted market capitalization in each country.
Stocks from Taiwan make up the biggest weight in the MSCI Emerging Markets index with 27.34%, followed by South Korea (23.72%) and China (19.03%). Top sectors within the MSCI Emerging Markets index are information technology (45.26%), financial services (18.40%) and consumer discretionary (7.23%). Source: MSCI; As of 30/06/2026
ETF investors can benefit from price gains and dividends of the MSCI Emerging Markets constituents. Currently, the MSCI Emerging Markets index is tracked by 23 ETFs.
Source: justETF.com; As of 15.07.26; Performance in EUR, based on the largest ETF.
The total expense ratio (TER) of MSCI Emerging Markets ETFs is between 0.09% p.a. and 0.55% p.a.. In comparison, most actively managed funds do cost much more fees per year. Calculate your individual cost savings by using our cost calculator.
| 1 | UBS Core MSCI EM UCITS ETF USD dis | 47.94% | ||
| 2 | HSBC MSCI Emerging Markets UCITS ETF USD (Acc) | 47.90% | ||
| 3 | Amundi Core MSCI Emerging Markets Swap UCITS ETF Dist | 47.86% |
All MSCI Emerging Markets ETFs ranked by fund return
| 1 | Xtrackers MSCI Emerging Markets UCITS ETF 1C | 11,686 m | ||
| 2 | iShares MSCI EM UCITS ETF (Dist) | 8,863 m | ||
| 3 | iShares MSCI EM UCITS ETF (Acc) | 8,468 m |
All MSCI Emerging Markets ETFs ranked by fund size
| 1 | BNP Paribas Easy MSCI Emerging UCITS ETF Acc | 0.09% p.a. | ||
| 2 | BNP Paribas Easy MSCI Emerging UCITS ETF EUR Acc | 0.09% p.a. | ||
| 3 | Invesco MSCI Emerging Markets UCITS ETF | 0.09% p.a. |
All MSCI Emerging Markets ETFs ranked by total expense ratio
Besides return, there are further important factors to consider when selecting a MSCI Emerging Markets ETF. In order to provide a sound decision basis, you find a list of all MSCI Emerging Markets ETFs with details on size, cost, age, use of profits, fund domicile and replication method ranked by fund size.
Compare all MSCI Emerging Markets ETFs in detail
Compare all MSCI Emerging Markets ETFs in a chart
| ETF name ISIN | Fund size in m EUR | TER in % | Use of profits | Fund domicile | Replication method | |
|---|---|---|---|---|---|---|
| Xtrackers MSCI Emerging Markets UCITS ETF 1CIE00BTJRMP35 | 11,686 | 0.18% p.a. | Accumulating | Ireland | Optimized sampling | |
| iShares MSCI EM UCITS ETF (Dist)IE00B0M63177 | 8,863 | 0.18% p.a. | Distributing | Ireland | Full replication | |
| iShares MSCI EM UCITS ETF (Acc)IE00B4L5YC18 | 8,468 | 0.18% p.a. | Accumulating | Ireland | Full replication | |
| Amundi Core MSCI Emerging Markets Swap UCITS ETF DistLU2573966905 | 5,057 | 0.14% p.a. | Distributing | Luxembourg | Unfunded swap | |
| Amundi Core MSCI Emerging Markets Swap UCITS ETF AccLU2573967036 | 4,978 | 0.14% p.a. | Accumulating | Luxembourg | Unfunded swap | |
| Amundi MSCI Emerging Markets Swap UCITS ETF EUR AccLU1681045370 | 4,143 | 0.20% p.a. | Accumulating | Luxembourg | Unfunded swap | |
| Amundi Core MSCI Emerging Markets UCITS ETF AccLU1437017350 | 4,061 | 0.18% p.a. | Accumulating | Luxembourg | Full replication | |
| HSBC MSCI Emerging Markets UCITS ETF USDIE00B5SSQT16 | 3,563 | 0.15% p.a. | Distributing | Ireland | Full replication | |
| UBS Core MSCI EM UCITS ETF USD disLU0480132876 | 2,704 | 0.15% p.a. | Distributing | Luxembourg | Optimized sampling | |
| State Street SPDR MSCI Emerging Markets UCITS ETF USDIE00B469F816 | 1,800 | 0.18% p.a. | Accumulating | Ireland | Full replication | |
| Amundi MSCI Emerging Markets Swap UCITS ETF USD AccLU1681045453 | 1,412 | 0.20% p.a. | Accumulating | Luxembourg | Unfunded swap | |
| HSBC MSCI Emerging Markets UCITS ETF USD (Acc)IE000KCS7J59 | 1,335 | 0.15% p.a. | Accumulating | Ireland | Full replication | |
| Amundi Core MSCI Emerging Markets UCITS ETF EUR DistLU1737652583 | 1,102 | 0.18% p.a. | Distributing | Luxembourg | Full replication | |
| Amundi MSCI Emerging Markets Swap II UCITS ETF EUR AccFR0010429068 | 890 | 0.55% p.a. | Accumulating | France | Unfunded swap | |
| Xtrackers MSCI Emerging Markets Swap UCITS ETF 1CLU0292107645 | 852 | 0.49% p.a. | Accumulating | Luxembourg | Unfunded swap | |
| Invesco MSCI Emerging Markets UCITS ETF IE00B3DWVS88 | 388 | 0.09% p.a. | Accumulating | Ireland | Unfunded swap | |
| Xtrackers MSCI Emerging Markets UCITS ETF 1DIE000GWA2J58 | 363 | 0.18% p.a. | Distributing | Ireland | Full replication | |
| iShares MSCI EM Swap UCITS ETF USD (Acc)IE000S3N6R34 | 206 | 0.14% p.a. | Accumulating | Ireland | Unfunded swap | |
| Xtrackers MSCI Emerging Markets Swap UCITS ETF 1DLU2675291913 | 187 | 0.18% p.a. | Distributing | Luxembourg | Unfunded swap | |
| UBS MSCI EM SF UCITS ETF USD accIE00B3Z3FS74 | 152 | 0.14% p.a. | Accumulating | Ireland | Swap-based | |
| BNP Paribas Easy MSCI Emerging UCITS ETF AccLU3086273813 | 58 | 0.09% p.a. | Accumulating | Luxembourg | Unfunded swap | |
| Amundi MSCI Emerging Markets Swap II UCITS ETF USD AccFR0010435297 | 47 | 0.55% p.a. | Accumulating | France | Unfunded swap | |
| BNP Paribas Easy MSCI Emerging UCITS ETF EUR AccLU3257630437 | 2 | 0.09% p.a. | Accumulating | Luxembourg | Unfunded swap |
Source: justETF.com; As of 15.07.26
The table shows the returns of all MSCI Emerging Markets ETFs in comparison. All return figures are including dividends as of month end. Besides the return the reference date on which you conduct the comparison is important. In order to find the best ETFs, you can also perform a chart comparison.
Source: justETF.com; As of 30.06.26; Calculations in EUR including dividends

