Deka STOXX Europe 50® UCITS ETF

ISIN DE000ETFL250

 | 

Ticker EL4Y

TER
0,19% p.a.
Politique de distribution
Distribution
Réplication
Physique
Taille du fonds
EUR 207 M
Date de lancement
8 avril 2009
Positions
50
  • Ce produit n’est pas autorisé à la commercialisation dans le pays sélectionné : Belgique. Les pays dans lesquels sa commercialisation est autorisée comprennent Allemagne.
 

Aperçu

Description

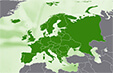
Le Deka STOXX Europe 50® UCITS ETF reproduit l'index STOXX® Europe 50. L'indice STOXX® Europe 50 suit l'évolution de 50 actions européennes à forte capitalisation.
 
Le ratio des frais totaux (TER) de l'ETF s'élève à 0,19% p.a.. L'ETF reproduit la performance de l’indice sous-jacent en achetant toutes les composantes de l’indice (réplication complète). Les dividendes de l'ETF sont distribués aux investisseurs (une fois par trimestre).
 
Le Deka STOXX Europe 50® UCITS ETF a des actifs sous gestion à hauteur de 207 M d'EUR. L'ETF a été lancé le 8 avril 2009 et est domicilié en Allemagne.
Afficher plus Afficher moins

Graphique

Basics

Data

Investment approach Long-only
Index
STOXX® Europe 50
Investment focus
Actions, Europe
Fund size
EUR 207 m
Total expense ratio
0,19% p.a.
Replication Physical (Full replication)
Legal structure ETF
Sustainability Non
Fund currency EUR
Currency hedged No
Inception/ Listing Date 8 avril 2009
Distribution policy Distributing
Distribution frequency Quarterly
Fund domicile Allemagne
Fund Provider Deka ETFs

Tax status

Germany 30% d’exonération partielle
Switzerland ESTV Reporting
Austria Meldefonds
UK Pas d’UK Reporting
Italy -
Indextype Price index
Swap counterparty -
Collateral manager Clearstream
Securities lending Yes
Securities lending counterparty

Similar ETFs

This section provides you with information on other ETFs with a similar investment focus to the Deka STOXX Europe 50® UCITS ETF .
Similar ETFs via ETF search
How do you like our ETF profile? Here you'll find our Questionnaire.

Holdings

Below you find information about the composition of the Deka STOXX Europe 50® UCITS ETF .

Top 10 Holdings

Weight of top 10 holdings
out of 50
40,23%
ASML Holding NV
9,39%
HSBC Holdings Plc
4,56%
Roche Holding AG
3,92%
Novartis AG
3,63%
Shell Plc
3,52%
AstraZeneca PLC
3,38%
Nestlé SA
3,13%
Siemens AG
3,06%
SAP SE
2,83%
Banco Santander SA
2,81%

Countries

Grande-Bretagne
24,89%
France
17,69%
Suisse
17,53%
Allemagne
13,07%
Autre
26,82%
Show more

Sectors

Finance
24,71%
Industrie
16,66%
Soins de santé
15,12%
Technologie
13,72%
Autre
29,79%
Show more
As of 30/09/2026

Performance

Les chiffres de performance incluent les distributions ou les dividendes, le cas échéant. Par défaut, la performance totale de l'ETF est affichée.

Returns overview

YTD +14.80%
1 month +3.81%
3 months +0.52%
6 months +10.79%
1 year +16.29%
3 years +55.04%
5 years +68.04%
Since inception (MAX) +424.29%
2025 +18.04%
2024 +7.99%
2023 +15.10%
2022 -2.08%

Monthly returns in a heat map

Dividends

Current dividend yield

Rendement actuel de distribution 2,21%
Dividends (last 12 months) EUR 1,23

Historic dividend yields

Period Dividend in EUR Dividend yield in %
1 an EUR 1,23 2,51%
2025 EUR 1,29 2,99%
2024 EUR 1,26 3,07%
2023 EUR 1,07 2,92%
2022 EUR 1,02 2,65%

Dividend yield contribution

Monthly dividends

Risk

Risk metrics in this section:
 
  • Volatility, annualised, measured for 1, 3 and 5 year periods. The annualised volatility reflects the degree of price fluctuations during a one year period. The higher the volatility, the more significantly the price of the asset (stock, ETF, etc.) has changed in the past. Assets with higher volatility are generally considered more risky. We calculate the volatility based on the data for the past 1, 3 and 5 years so that you can see if price fluctuations for the ETF became stronger or weaker over time.
  • Return per risk for 1, 3 and 5 year periods. This is the annualised (i.e. converted to a one year period) past return divided by the past annualised volatility. The metric puts the historical return of an asset in relation to its historical risk and gives you a retrospective indication of the degree of price fluctuation you had to bear with in order to obtain the return. We calculate this parameter for 1, 3 and 5 year periods to display its evolution over time.
  • Maximum drawdown for a period. This shows the worst possible loss an investor could have suffered during the respective period, by first buying and subsequently selling the asset at the least favourable prices. For example, if there was the following sequence of daily ETF prices: 10€, 5€, 12€, 20€, an investor would have suffered the worst loss by buying for 10€ and subsequently selling for 5€. Therefore in this case the maximum drawdown would be (5€ - 10€)/10€ = -50%.
ETF returns include dividend payments (if applicable).
Show more Show less

Risk overview

Risk indicator
  1. 1
  2. 2
  3. 3
  4. 4
  5. 5
  6. 6
  7. 7
Lower risk Higher risk
Volatility 1 year 12.65%
Volatility 3 years 12.41%
Volatility 5 years 13.46%
Return per risk 1 year 1.29
Return per risk 3 years 1.27
Return per risk 5 years 0.81
Maximum drawdown 1 year -9.47%
Maximum drawdown 3 years -17.03%
Maximum drawdown 5 years -17.03%
Maximum drawdown since inception -32.12%

Rolling 1 year volatility

Stock exchange

Listings

Listing Trade Currency Ticker Bloomberg /
iNAV Bloomberg Code
Reuters RIC /
iNAV Reuters
Market Maker
gettex EUR EL4Y -
-
-
-
-
Bourse de Stuttgart EUR EL4Y -
-
-
-
-
XETRA EUR EL4Y ETFSTX5 GR
ISTX5
ETFSTX5.DE
ISX5.DE
BNP Paribas

Plus d'informations

Autres ETF ayant un objectif d'investissement similaire

Nom du fonds Taille du fonds en M € (AuM) Frais annuels Distribution Réplication
iShares Core MSCI Europe UCITS ETF EUR (Dist) 11 108 0,12% p.a. Distribution Échantillonnage
Xtrackers EURO STOXX 50 UCITS ETF 1D 6 046 0,09% p.a. Distribution Complète
iShares Core EURO STOXX 50 UCITS ETF EUR (Dist) 5 670 0,10% p.a. Distribution Complète
iShares MSCI Europe CTB Enhanced ESG UCITS ETF EUR (Dist) 5 416 0,12% p.a. Distribution Échantillonnage
Vanguard FTSE Developed Europe UCITS ETF Distributing 4 995 0,10% p.a. Distribution Complète

Questions fréquemment posées

Quel est le nom de EL4Y ?

Le nom de EL4Y est Deka STOXX Europe 50® UCITS ETF .

Quel est le sigle de Deka STOXX Europe 50® UCITS ETF ?

Le sigle de Deka STOXX Europe 50® UCITS ETF est EL4Y.

Quel est l’ISIN de Deka STOXX Europe 50® UCITS ETF ?

L’ISIN de Deka STOXX Europe 50® UCITS ETF est DE000ETFL250.

Quels sont les coûts de Deka STOXX Europe 50® UCITS ETF ?

Le ratio des frais totaux (TER) de Deka STOXX Europe 50® UCITS ETF s'élève à 0,19% p.a.. Ces coûts sont prélevés en continu sur les actifs du fonds et sont déjà inclus dans la performance de l'ETF. Vous n'avez pas à les payer séparément. Veuillez consulter notre article pour plus d'informations sur le coût des ETF.

Le Deka STOXX Europe 50® UCITS ETF verse-t-il des dividendes ?

Oui, le Deka STOXX Europe 50® UCITS ETF verse des dividendes. Habituellement, les paiements de dividendes ont lieu une fois par trimestre pour le Deka STOXX Europe 50® UCITS ETF .

Quelle est la taille du fonds de Deka STOXX Europe 50® UCITS ETF ?

La taille du fonds de Deka STOXX Europe 50® UCITS ETF est de 207 millions d'euros.

Suivez vos stratégies ETF en ligne

— Data provided by Trackinsight, etfinfo, Xignite Inc., gettex, FactSet and justETF GmbH.

Quotes are either real-time (gettex) or 15 minutes delayed stock exchange quotes or NAVs (daily published by the fund provider). By default, ETF returns include dividend payments (if applicable). There is no warranty for completeness, accuracy and correctness for the displayed information.