
TER
0,48% p.a.
Distributiebeleid
Accumulerend
Replicatie
Synthetisch
Fondsgrootte
EUR 61 m
Startdatum
25 april 2019
Bedrijven
1.478
Overzicht
Beschrijving
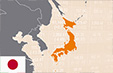
The Amundi PEA Japan (TOPIX) UCITS ETF EUR Hedged seeks to track the TOPIX® (EUR Hedged) index. The TOPIX® (EUR Hedged) index tracks Japanese stocks on the TSE First Section segment of the Tokyo Stock Exchange, which comprises the largest market capitalisations. Currency hedged to Euro (EUR).
Grafiek
Basis
Data
| Beleggingsaanpak | Langdurig |
| Index | TOPIX® (EUR Hedged) |
| Investeringsfocus | Aandelen, Japan |
| Fondsgrootte | EUR 61 m |
| Totale kostenratio (TER) | 0,48% p.a. |
| Replicatie | Synthetisch (Niet-gefinancierde swap) |
| Juridische structuur | ETF |
| Duurzaamheid | No |
| Valuta van het fonds | EUR |
| Valuta-afgedekt | Yes |
| Startdatum/Noteringsdatum | 25 april 2019 |
| Distributiebeleid | Accumulerend |
| Vestigingsplaats van het fonds | Frankrijk |
| Fondsaanbieder | Amundi ETF |
Belastingstatus
| Duitsland | Onbekend |
| Zwitserland | Geen ESTV-rapportage |
| Oostenrijk | Niet-belastingplichtig fonds |
| UK | Geen UK-rapportage |
| Italië | - |
| Fondsstructuur | Contractual Fund |
| UCITS-conformiteit | Yes |
| Administrateur | CACEIS Fund Administration France |
| Beleggingsadviseur | |
| Bewaarbank | CACEIS BANK |
| Revisiebedrijf | PRICEWATERHOUSECOOPERS Audit |
| Einde belastingjaar | 30 juni |
| Vertegenwoordiger van Zwitserland | CACEIS (Switzerland) SA |
| Zwitserse uitbetalende instantie | CACEIS Bank, Paris, succursale de Nyon / Suisse |
| Indextype | Totale rendementsindex |
| Swap tegenpartij | Société Générale |
| Collateral manager | |
| Effectenlening | No |
| Tegenpartij die effecten uitleent |
Vergelijkbare ETF
In dit gedeelte vind je informatie over andere ETF met een vergelijkbare beleggingsfocus als de Amundi PEA Japan (TOPIX) UCITS ETF EUR Hedged
Vergelijkbare ETF via ETF zoeken
Vergelijkbare ETF via beleggingsgidsen

Wat vind je van ons ETF-profiel? Here you'll find our Questionnaire.
Bedrijven
Hieronder vind je informatie over de samenstelling van de Amundi PEA Japan (TOPIX) UCITS ETF EUR Hedged
Top 10 holdings
Weging van top 10-holdings
van 1.478
23,48%
| Mitsubishi UFJ Financial Group, Inc. | 3,90% |
| Toyota Motor Corp. | 2,56% |
| Sumitomo Mitsui Financial Group, Inc. | 2,52% |
| Hitachi Ltd. | 2,46% |
| Sony Group Corp. | 2,16% |
| SoftBank Group Corp. | 2,14% |
| Recruit Holdings Co., Ltd. | 2,01% |
| Mizuho Financial Group, Inc. | 1,99% |
| Tokyo Electron Ltd. | 1,99% |
| Advantest Corp. | 1,75% |
Landen
| Japan | 100,00% |
| Anders | 0,00% |
Sectoren
| Technologie | 20,97% |
| Financiën | 20,43% |
| Industrie | 19,59% |
| Consumentencyclische producten | 8,88% |
| Anders | 30,13% |
Vanaf 24/09/2026
Prestaties
Rendementsoverzicht
| YTD | +17,79% |
| 1 maand | -3,94% |
| 3 maanden | +0,26% |
| 6 maanden | +6,78% |
| 1 jaar | +20,76% |
| 3 jaar | +86,43% |
| 5 jaar | +124,29% |
| Since inception | +184,40% |
| 2025 | +25,85% |
| 2024 | +22,71% |
| 2023 | +31,28% |
| 2022 | -3,95% |
Maandelijks rendement in een heat map
Risico
Risk metrics in this section:
- Volatility, annualised, measured for 1, 3 and 5 year periods. The annualised volatility reflects the degree of price fluctuations during a one year period. The higher the volatility, the more significantly the price of the asset (stock, ETF, etc.) has changed in the past. Assets with higher volatility are generally considered more risky. We calculate the volatility based on the data for the past 1, 3 and 5 years so that you can see if price fluctuations for the ETF became stronger or weaker over time.
- Return per risk for 1, 3 and 5 year periods. This is the annualised (i.e. converted to a one year period) past return divided by the past annualised volatility. The metric puts the historical return of an asset in relation to its historical risk and gives you a retrospective indication of the degree of price fluctuation you had to bear with in order to obtain the return. We calculate this parameter for 1, 3 and 5 year periods to display its evolution over time.
- Maximum drawdown for a period. This shows the worst possible loss an investor could have suffered during the respective period, by first buying and subsequently selling the asset at the least favourable prices. For example, if there was the following sequence of daily ETF prices: 10€, 5€, 12€, 20€, an investor would have suffered the worst loss by buying for 10€ and subsequently selling for 5€. Therefore in this case the maximum drawdown would be (5€ - 10€)/10€ = -50%.
Risico-overzicht
| Risico-indicator |
Lager risico Hoger risico |
| Volatiliteit 1 jaar | 19,71% |
| Volatiliteit 3 jaar | 20,92% |
| Volatiliteit 5 jaar | 19,10% |
| Rendement / Risico 1 jaar | 1,05 |
| Rendement / Risico 3 jaar | 1,10 |
| Rendement / Risico 5 jaar | 0,92 |
| Maximaal waardedaling 1 jaar | -11,56% |
| Maximaal waardedaling 3 jaar | -24,39% |
| Maximaal waardedaling 5 jaar | -24,39% |
| Maximaal waardedaling sinds aanvang | -29,56% |
Voortschrijdende volatiliteit over 1 jaar
Beurs
Beursnoteringen
| Beursnotering | Handelsvaluta | Ticker | Bloomberg / iNAV Bloomberg Code | Reuters RIC / iNAV Reuters | Market Maker |
|---|---|---|---|---|---|
| Euronext Parijs | EUR | PTPXH | PTPXH FP IPTPH | PTPXH.PA IPTPH=BNPP | BNP Paribas Arbitrage |
Meer informatie
Verdere ETF op de TOPIX® (EUR Hedged)-index
| Naam fonds | Fondsgrootte in €m (AuM) | TER p.j. | Distributie | Replicatiemethode |
|---|---|---|---|---|
| Amundi Japan TOPIX II UCITS ETF EUR Hedged Dist | 113 | 0,45% p.a. | Distribueren | Volledige replicatie |





Nieuwste artikelen


Veelgestelde vragen
What is the name of PTPXH?
The name of PTPXH is Amundi PEA Japan (TOPIX) UCITS ETF EUR Hedged.
What is the ticker of Amundi PEA Japan (TOPIX) UCITS ETF EUR Hedged?
The primary ticker of Amundi PEA Japan (TOPIX) UCITS ETF EUR Hedged is PTPXH.
What is the ISIN of Amundi PEA Japan (TOPIX) UCITS ETF EUR Hedged?
The ISIN of Amundi PEA Japan (TOPIX) UCITS ETF EUR Hedged is FR0013411998.
What are the costs of Amundi PEA Japan (TOPIX) UCITS ETF EUR Hedged?
The total expense ratio (TER) of Amundi PEA Japan (TOPIX) UCITS ETF EUR Hedged amounts to 0,48% p.a.. These costs are withdrawn continuously from the fund assets and already included in the performance of the ETF. You don't have to pay them separately. Please have a look at our article for more information about the cost of ETFs.
Is Amundi PEA Japan (TOPIX) UCITS ETF EUR Hedged paying dividends?
Amundi PEA Japan (TOPIX) UCITS ETF EUR Hedged is an accumulating ETF. This means that dividends are not distributed to investors. Instead, dividends are reinvested in the fund on the ex-date, which leads to an increase of the ETF's share price.
What's the fund size of Amundi PEA Japan (TOPIX) UCITS ETF EUR Hedged?
The fund size of Amundi PEA Japan (TOPIX) UCITS ETF EUR Hedged is 61m Euro. See the following article for more information about the size of ETFs.
— Gegevens verstrekt door Trackinsight, etfinfo, Xignite Inc., gettex, FactSet en justETF GmbH.
Standaard zijn ETF-rendementen inclusief dividenduitkeringen (indien van toepassing). Er is geen garantie voor de volledigheid, juistheid en correctheid van de getoonde informatie.