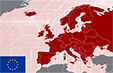
State Street Europe Small Cap Screened Equity Fund UCITS ETF

ISIN LU3121015484

 | 

WKN A41ENM

 | 

Ticker SEAP

TER
0,85% p.a.
Distributiebeleid
Thesaurierend
Replicatie
Physisch
Fondsgrootte
EUR 4 m
Startdatum
25. November 2025
Bedrijven
197
 

Overzicht

Verhandel deze ETF bij je broker

Kies uw broker

Beschrijving

De State Street Europe Small Cap Screened Equity Fund UCITS ETF is een actief beheerde ETF.
Der ETF investiert in europäische Unternehmen mit kleiner Marktkapitalisierung und versucht eine höhere Rendite zu erwirtschaften als der MSCI Europe Small Cap Index. Die enthaltenen Titel werden nach ESG-Kriterien (Umwelt, Soziales und Unternehmensführung) gefiltert.
 
The ETF's TER (total expense ratio) amounts to 0,85% p.a.. The dividends in the ETF are accumulated and reinvested in the ETF.
 
The State Street Europe Small Cap Screened Equity Fund UCITS ETF is a very small ETF with 4m Euro assets under management. The ETF was launched on 25 november 2025 and is domiciled in Luxemburg.
Toon meer Toon minder

Grafiek

Basis

Data

Beleggingsaanpak Actief beheerd
Investeringsfocus
Aktien, Europa, Small Cap
Fondsgrootte
EUR 4 m
Totale kostenratio (TER)
0,85% p.a.
Juridische structuur ETF
Duurzaamheid Ja
Valuta van het fonds EUR
Valuta-afgedekt No
Startdatum/Noteringsdatum 25. November 2025
Distributiebeleid Accumulerend
Vestigingsplaats van het fonds Luxemburg
Fondsaanbieder State Street

Belastingstatus

Duitsland Nicht bekannt
Zwitserland Kein ESTV Reporting
Oostenrijk Nicht-Meldefonds
UK UK Reporting
Italië 26,0%
Indextype -
Swap tegenpartij -
Collateral manager
Effectenlening Yes
Tegenpartij die effecten uitleent BARCLAYS BANK PLC|BARCLAYS CAPITAL SECURITIES LIMITED|BNP PARIBAS|BNP PARIBAS ARBITRAGE SNC|CITIGROUP GLOBAL MARKETS LIMITED|CREDIT SUISSE INTERNATIONAL|GOLDMAN SACHS INTERNATIONAL|HSBC BANK PLC|ING BANK NV|JP MORGAN SECURITIES PLC|MACQUARIE BANK LIMITED|MERRILL LYNCH INTERNATIONAL|MORGAN STANLEY & CO. INTERNATIONAL PLC.|NOMURA INTERNATIONAL PLC|RBC EUROPE LIMITED|SKANDINAVISKA ENSKILDA BANKEN AB (PUBL)|SOCIETE GENERALE SA|UBS AG

Vergelijkbare ETF

In dit gedeelte vind je informatie over andere ETF met een vergelijkbare beleggingsfocus als de State Street Europe Small Cap Screened Equity Fund UCITS ETF
Vergelijkbare ETF via ETF zoeken
Wat vind je van ons ETF-profiel? Here you'll find our Questionnaire.

Bedrijven

Hieronder vind je informatie over de samenstelling van de State Street Europe Small Cap Screened Equity Fund UCITS ETF

Top 10 holdings

Weging van top 10-holdings
van 197
13,08%
Jyske Bank A/S
1,47%
Umicore SA
1,41%
voestalpine AG
1,34%
SBM Offshore NV
1,33%
Balfour Beatty
1,31%
Man Group Jersey
1,29%
Loomis AB
1,27%
Inchcape Plc
1,24%
Koninklijke BAM Groep NV
1,21%
Vontobel Holding AG
1,21%

Landen

Großbritannien
25,82%
Schweden
11,85%
Frankreich
10,32%
Schweiz
8,64%
Sonstige
43,37%
Toon meer

Sectoren

Finanzen
27,38%
Industrie
20,59%
Zyklische Konsumgüter
9,23%
Nicht-energetische Grundstoffe
7,42%
Sonstige
35,38%
Toon meer
Vanaf 31.08.2026

Orderkosten

Hier findest du Informationen zu verschiedenen Brokern, bei denen du ETFs handeln kannst. Wähle den gewünschten Orderbetrag aus, um die dabei anfallenden Gebühren bei den einzelnen Brokern zu vergleichen.
 
Broker Rating Ordergebühr ETF-Sparpläne
0,99 €
3646
Bekijk aanbod**
0,95 €
2530
Bekijk aanbod*
0,00 €
1868
Bekijk aanbod*
0,00 €
2274
Bekijk aanbod*
9,95 €
1967
Bekijk aanbod*
Toon alles
Bron: justETF Research; Vanaf 10/2026. De aanbiedingen zijn als volgt gesorteerd: 1. Rating 2. Orderkosten 3. Aantal ETF-beleggingsplannen. Er kan geen garantie worden gegeven voor de volledigheid en juistheid van de vermelde informatie. De informatie van de online brokers is doorslaggevend. Naast de aangegeven makelaarskosten kunnen extra kosten (bijv. spreads, fooien en productkosten) van toepassing zijn.
*Affiliate link
** Belangrijke opmerking: Sinds 2021 maken wij deel uit van de Scalable-groep en zijn wij een 100% dochteronderneming van Scalable AG. Hierdoor zijn wij economisch verbonden, maar redactioneel onafhankelijk. Belangenconflicten worden vermeden, omdat brokers – inclusief Scalable – worden beoordeeld volgens uniforme, objectieve criteria. Want uiteindelijk moet jij zelf beslissen hoe en bij wie je wilt beleggen.

Prestaties

Rendementsoverzicht

YTD +12,75%
1 maand -0,66%
3 maanden +1,60%
6 maanden +7,31%
1 jaar -
3 jaar -
5 jaar -
Since inception +20,30%
2025 -
2024 -
2023 -
2022 -

Maandelijks rendement in een heat map

Risico

Risk metrics in this section:
 
  • Volatility, annualised, measured for 1, 3 and 5 year periods. The annualised volatility reflects the degree of price fluctuations during a one year period. The higher the volatility, the more significantly the price of the asset (stock, ETF, etc.) has changed in the past. Assets with higher volatility are generally considered more risky. We calculate the volatility based on the data for the past 1, 3 and 5 years so that you can see if price fluctuations for the ETF became stronger or weaker over time.
  • Return per risk for 1, 3 and 5 year periods. This is the annualised (i.e. converted to a one year period) past return divided by the past annualised volatility. The metric puts the historical return of an asset in relation to its historical risk and gives you a retrospective indication of the degree of price fluctuation you had to bear with in order to obtain the return. We calculate this parameter for 1, 3 and 5 year periods to display its evolution over time.
  • Maximum drawdown for a period. This shows the worst possible loss an investor could have suffered during the respective period, by first buying and subsequently selling the asset at the least favourable prices. For example, if there was the following sequence of daily ETF prices: 10€, 5€, 12€, 20€, an investor would have suffered the worst loss by buying for 10€ and subsequently selling for 5€. Therefore in this case the maximum drawdown would be (5€ - 10€)/10€ = -50%.
ETF-rendementen zijn inclusief dividenduitkeringen (indien van toepassing).
Toon meer Toon minder

Risico-overzicht

Volatiliteit 1 jaar -
Volatiliteit 3 jaar -
Volatiliteit 5 jaar -
Rendement / Risico 1 jaar -
Rendement / Risico 3 jaar -
Rendement / Risico 5 jaar -
Maximaal waardedaling 1 jaar -
Maximaal waardedaling 3 jaar -
Maximaal waardedaling 5 jaar -
Maximaal waardedaling sinds aanvang -9,44%

Voortschrijdende volatiliteit over 1 jaar

Beurs

Beursnoteringen

Beursnotering Handelsvaluta Ticker Bloomberg /
iNAV Bloomberg Code
Reuters RIC /
iNAV Reuters
Market Maker
Borsa Italiana EUR SEAP -
-
-
-
-
SIX Swiss Exchange EUR SEAP

Meer informatie

Andere ETF met vergelijkbare beleggingsfocus

Naam fonds Fondsgrootte in €m (AuM) TER p.j. Distributie Replicatiemethode
Amundi MSCI EMU Small Cap ESG Broad Transition UCITS ETF Dist 555 0,40% p.a. Distribueren Volledige replicatie
iShares EURO STOXX Small UCITS ETF 412 0,40% p.a. Distribueren Sampling
Vanguard FTSE Developed Europe Small-Cap UCITS ETF EUR Dist 1 0,19% p.a. Distribueren Volledige replicatie

Veelgestelde vragen

What is the name of SEAP?

The name of SEAP is State Street Europe Small Cap Screened Equity Fund UCITS ETF.

What is the ticker of State Street Europe Small Cap Screened Equity Fund UCITS ETF?

The primary ticker of State Street Europe Small Cap Screened Equity Fund UCITS ETF is SEAP.

What is the ISIN of State Street Europe Small Cap Screened Equity Fund UCITS ETF?

The ISIN of State Street Europe Small Cap Screened Equity Fund UCITS ETF is LU3121015484.

What are the costs of State Street Europe Small Cap Screened Equity Fund UCITS ETF?

The total expense ratio (TER) of State Street Europe Small Cap Screened Equity Fund UCITS ETF amounts to 0,85% p.a.. These costs are withdrawn continuously from the fund assets and already included in the performance of the ETF. You don't have to pay them separately. Please have a look at our article for more information about the cost of ETFs.

Is State Street Europe Small Cap Screened Equity Fund UCITS ETF paying dividends?

State Street Europe Small Cap Screened Equity Fund UCITS ETF is an accumulating ETF. This means that dividends are not distributed to investors. Instead, dividends are reinvested in the fund on the ex-date, which leads to an increase of the ETF's share price.

What's the fund size of State Street Europe Small Cap Screened Equity Fund UCITS ETF?

The fund size of State Street Europe Small Cap Screened Equity Fund UCITS ETF is 4m Euro. See the following article for more information about the size of ETFs.

Track your ETF strategies online

— Les données utilisées sont mises à disposition par Trackinsight, etfinfo, Xignite Inc., gettex, FactSet et justETF GmbH.

Les cotations sont des cotations en temps réel (gettex), des cotations boursières retardées de 15 minutes ou des VNI (quotidiennes publiées par le fournisseur du fonds). Par défaut, les rendements des ETF incluent les paiements de dividendes (le cas échéant). Aucune garantie n'est donnée quant à l'exhaustivité, la précision et l'exactitude des informations affichées.