Smart Beta strategies target objectives such as market-beating returns, lower volatility, and enhanced diversification. The question is, do they work?
Level: For all
Reading time: 8 minutes
The goal of a Smart Beta Exchange Traded Fund (ETF) is to beat the market or to match it while taking less risk. That’s exactly what an active investing product would hope to do. Yet Smart Beta ETFs are also rule-based, transparent, and low-cost like standard broad market ETFs that track the MSCI World or S&P 500.
So the tantalising promise of Smart Beta is that it offers the best-of-both-worlds:
A viable shot at outperforming the market - either outright or on a risk-adjusted basis.
Using a systematic, replicable strategy that doesn’t depend on excessively expensive and mercurial management teams.
Extraordinary claims must be backed up by extraordinary evidence, and the good news is that Smart Beta (also known as ‘risk factor’) strategies have a good deal of evidence stacked up in their favour.
The best risk factor strategies have been identified and verified by multiple teams of financial academics.
Their results have been published in leading financial journals and subjected to intense scrutiny.
Over time, the strategies have been refined and found to work across multiple time periods and markets.
Finally, the findings have proved robust enough to be used as the basis of successful investible products from leading fund management houses like Vanguard, BlackRock (iShares) and State Street (SPDR) among others.
Smart Beta ETFs went mainstream over ten years ago, although some funds have existed in the US since the 1990s. Which provides us with a reasonable timeframe to assess how the products have performed in real-life - and beyond the confines of academic debate. You can see the results below.
For all their promise, Smart Beta strategies have clear downsides too. First among those: there's no guarantee that risk factor products will outperform the market. Risk can never be fully neutralised in investing. The fact is that without risk there’s no reward. So we’ll talk more about the drawbacks too.
But first, let’s delve a little deeper into what Smart Beta actually is.
How do Smart Beta strategies work?
Smart Beta products work by targeting stocks with particular characteristics.
Each strategy uses a distinct set of metrics to identify its best-fit stocks. For example, a strategy may concentrate on stocks that are especially cheap, or small, or less volatile than average.
The underlying research shows that portfolios of stocks exhibiting these traits can:
Beat the wider stock market.
Or achieve better risk-adjusted returns than the market.
justETF tip: Risk-adjusted returns refer to the average returns generated by an asset for a given amount of volatility. Thus a stock may deliver returns that are lower than the market average, yet achieve higher risk-adjusted returns because its volatility is lower than normal. In other words, the stock generates high returns relative to the risk borne by its investors. This behaviour is characteristic of so-called defensive stocks.
Most Smart Beta ETFs follow an index that tilts towards stocks with traits conforming to the fund’s underlying strategy. For example, a Value factor ETF will focus on firms that are cheap according to defined stock market valuation measures.
Some Smart Beta ETFs don’t follow a recognised index but still use clear rules-based strategies to pinpoint the stocks that exhibit the desired characteristics.
The Smart Beta strategies to look out for
The most credible and popular Smart Beta factors are:
Value
USP: Cheap firms
Risk: Higher than normal market risk
Reward: Beat the market
Value companies are sluggish, unglamorous firms that are often saddled with debt, volatile dividends and a high degree of earnings risk. Their position looks weak and they tend to be heavily punished during recessions. Investors are known to underrate these stocks in comparison to sexy, high-growth firms like tech start-ups. This helps explain why a Value firm’s comparative cheapness can be a source of strong future returns.
The Value factor further splits into Large Cap Value (large cheap firms) and Small Cap value (small cheap firms).
Small Cap
USP: Small firms
Risk: Higher than normal market risk
Reward: Beat the market
Smaller companies are riskier than larger ones because they’re more vulnerable to misfortune. For example, bad management, the loss of key staff, a regulatory change or the predations of bigger rivals can all ruin the outlook for a small firm. Hence investors expect a greater investment return in exchange for taking on greater risk.
Equal-weighted ETFs are a variant of the Small Cap strategy because they overweight the smaller stocks in their index.
Quality
USP: Efficient firms
Risk: Lower than normal market risk
Reward: Better risk-adjusted returns
Companies that make the most efficient use of their capital tend to outperform less efficient rivals over time. For example, a company that invests heavily in R&D is more likely to produce innovative products that enable it to make hay in the years ahead. However, people often underrate quality firms because their high rate of current investment spending makes them look like they’re underperforming in comparison to cost-cutting rivals.
The ultimate promise of Quality stocks is they offer similar or slightly higher long-run returns than the market but with lower volatility. Thus the objective is to achieve better expected risk-adjusted returns.
Momentum
USP: Winning firms
Risk: Higher than normal market risk
Reward: Beat the market
Momentum strategies buy recent winners and sell recent losers. That’s because rising stocks tend to keep rising for a limited period (12 months or less) while losing stocks carry on falling.
One explanation for the phenomenon is that investors tend to over-react and under-react to the news. For example, pushing the price of a darling company to new heights even when its market position erodes. Or shunning a weak firm despite evidence of a turn around. As such, Momentum factor stocks often outperform when the market trends higher but can suffer extreme shocks when the market abruptly reverses.
Low Volatility
USP: Defensive equities
Risk: Lower than normal market risk
Reward: Better risk-adjusted returns
Low Volatility (also Minimum Volatility) stocks have historically delivered market-like returns but for significantly less risk. Low Vol companies tend to be large, non-cyclical outfits that are resilient during recessions. For example, we need utility companies to keep powering our homes no matter what, so their profits aren’t badly hit even during tough times. However, profits are unlikely to soar during boom times either as people don’t tend to keep the heating on all day just because they can.
Good to know
Although the factors above have been found to outperform the market or reduce market risk in the past, we can’t assume they will continue to do so in the future.
For one thing, factors can fall out of favour and lag the market for many years. This is perfectly normal and can happen to any sub-asset class.
Similarly, outperformance can disappear due to increased investor interest in factor strategies bidding up prices for previously undervalued stocks.
The risks are genuine but, by bearing them, investors expect to be rewarded with greater returns when economic conditions and sentiment cause individual factors to bounce back.
New investors should, therefore, understand that the Smart Beta promise of market-beating returns will not necessarily come true and you may have to endure years of underperformance before your investment pays off. In any case, past trends do not predict the future. Conditions can and will change.
For all of these reasons, Smart Beta investors rarely go all-in. Instead, think of risk factor positions as satellite investments that diversify your core holdings.
How have Smart Beta strategies performed?
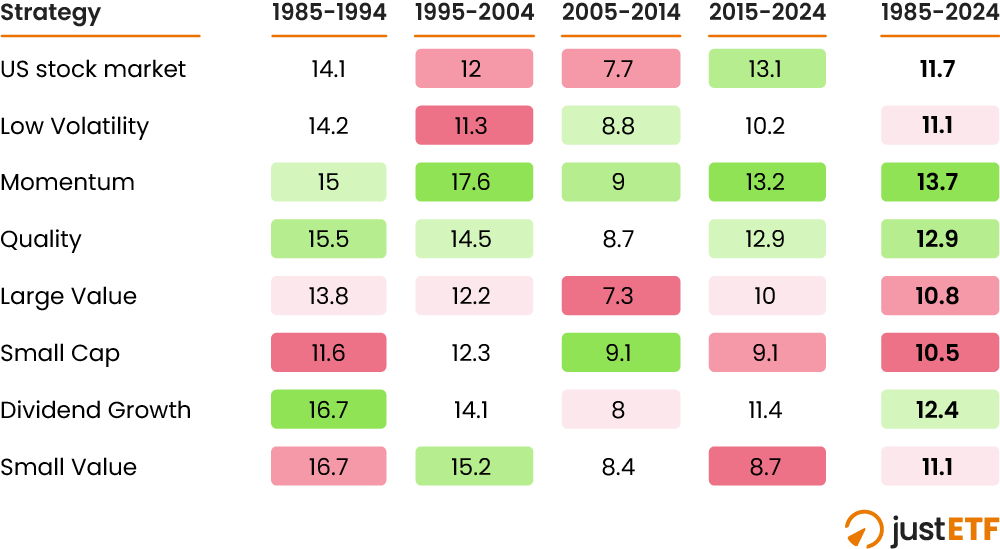
The following table shows how the main Smart Beta strategies performed over the last forty years. We’ve included the broad market (US stocks) and the Dividend Growth strategy by way of comparison.
The US stock market is our chosen benchmark - rather than the MSCI World - because Smart Beta products were launched in the US long before they arrived in Europe.
Hence we must rely on US-only risk factor results for the longest term view.
Moreover, because Smart Beta strategies wax and wane over time, we break out the complete forty year run into its constituent ten-year periods as well:
40-year-returns of Smart Beta strategies
Source: MSCI, iShares, S&P Global, and Vanguard. Nominal USD total returns.Key: Strategy ranking by annualised return, green = highest returns, red = lowest returns
The right-hand column shows that only US Momentum, Quality, and Dividend Growth actually beat the market over the full forty year period.
That shows how tough the market is to beat. That said, Low Volatility also beat the market on a risk adjusted basis. As in, the strategy endured less volatility for every point of return earned in comparison to US stocks as a whole.
Digging deeper, you can see that different strategies triumphed during different time periods.
Momentum was the best strategy or in the top three in every time period. That’s not surprising as Momentum’s overall 1985-2024 victory is dependent on the period’s constituent time segments.
But we can also see that the broad market was often laid low. In particular, US stocks were dragged down by the Dotcom Bust (2000 to 2003) and the Global Financial Crisis (2007 to 2009).
Small Value and Small Cap noticeably bucked the market during the periods containing those reversals.
On balance, this live-fire test of Smart Beta allows us to draw a few conclusions:
Some strategies have beaten the market over the long run.
However some strategies failed to live up to their market-beating billing.
The various strategies respond differently as conditions change. This suggests there may be value in risk-factor diversification - in the same way we diversify across different regions of the world.
Even forty years of evidence doesn’t indicate that the lacklustre strategies are broken.
For one thing the US market doesn’t account for the entire world. Intriguingly, International ex-US figures show that Small Value ex-US convincingly beat the International market over the longest comparable time period: 1990 to 2024.
Large Value ex-US edged the market by the thinnest of margins while Small Cap ex-US fell short.
The other risk factor strategies didn’t exist in International ex-US form until the 2010s.
justETF tip: International typically means developed world markets excluding the US in American asset management terminology.
Smart Beta UCITS ETF comparison
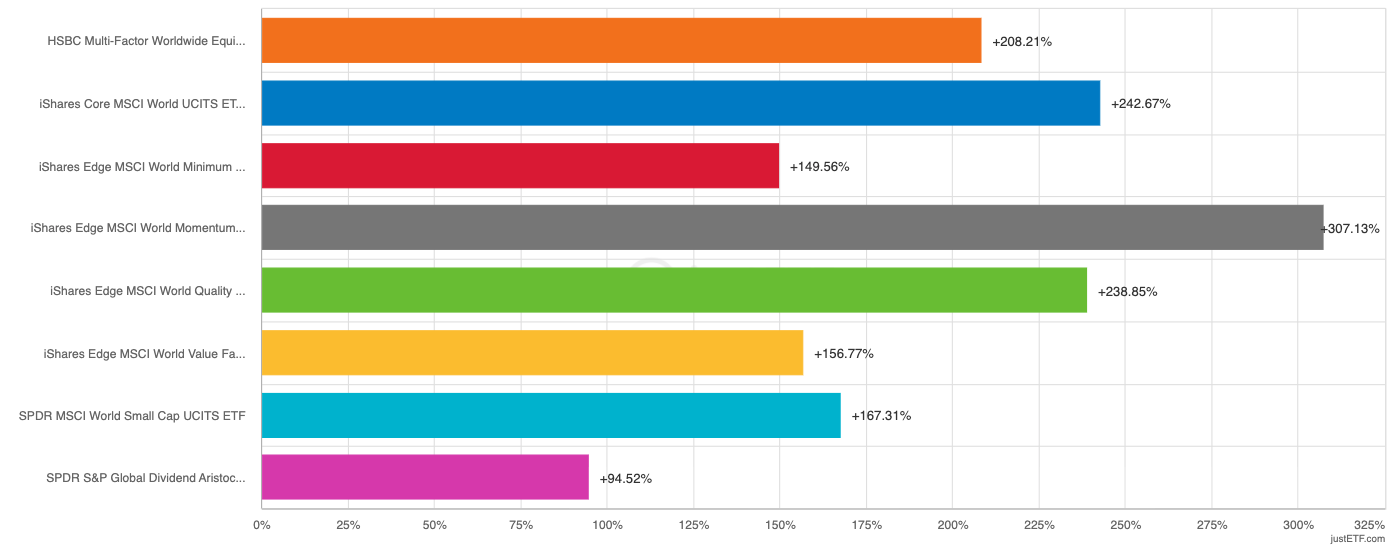
World including US versions of the Smart Beta strategies have a shorter history. But happily the data is in for a long-run comparison of European-investor orientated UCITS ETFs:
Source: justETF Research; 3 October 2014 to 16 December 2025.
Momentum (grey bar) beat the market (blue bar) and Quality came in third (green bar). Bear in mind that these ETFs are dominated by US stocks, so it’s no surprise the order is similar to the 2015-2024 column of the previous table.
However, the order moves around more noticeably lower down the rankings - with the Dividend Growth strategy being the big loser on the world stage.
Meanwhile, the diversification case is made by the Multi-Factor ETF (orange bar) which bundles the Momentum, Quality, Value, Low Volatility, and Small Cap strategies into a single product.
The ETF didn’t beat the market from 2014 to 2025 but that doesn’t mean it can’t in the future.
Finally, the first UCITS World / Global Small Value ETF only launched in September 2024 so we don’t yet have a truly comparable long-term track record for this strategy.
Smart Beta diversification
Let’s close out our analysis by exploring the case for Smart Beta diversification in more depth.
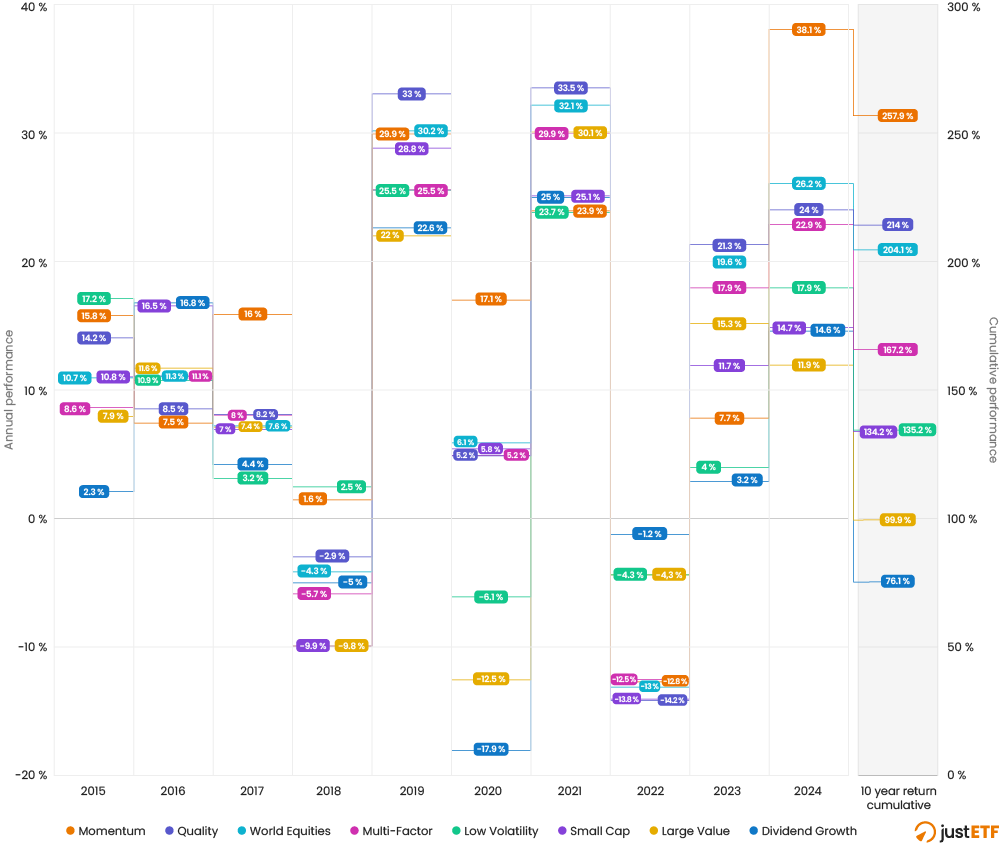
While Momentum and Quality look good overall, you can’t predict which strategy will dominate in any given year:
Source: justETF Research; 31 December 2014 to 31 December 2024.
The individual strategies rose and fell down the years like the fortunes of medieval courtiers. Though again, it’s clear the broad market (World equities) was consistently good. Also, the diversified Multi-Factor ETF navigated the middle ground - it was never the best and never the worst.
Meanwhile, Low Volatility did deliver on its USP as a defensive equities option. Low Volatility outperformed the market and most of the other strategies during the two down years of 2018 and 2022.
Granted, it was still negative in 2022 but much less so than the broad market. Of course, we can’t assume Low Volatility will always behave on cue but the evidence suggests that the strategy generally works as promised.
Quality did not live up to its low drawdown reputation in 2022 but provided mild relief in 2018 while serving up market-beating returns across the period.
Stepping back, the overall picture suggests that Smart Beta strategies should be diversified like any other source of return.
Historical correlations are a good way to measure diversification power.
The record shows that some factors have low correlations with one another. In other words, the underperformance of one can be offset by the outperformance of another. For example, Value is known to have low correlations with Quality and Momentum, so it tends to behave differently over time.
Smart Beta correlations
Factors with low correlations are complementary from a diversification perspective:
Different country’s stock markets are typically highly correlated, especially during a global slump.
If the US is down then Europe, Japan, and even the Emerging Markets generally follow suit.
Similarly, the risk factors also tend to dip in concert with the broad market.
But from a diversification perspective, Smart Beta ETFs can tap into sources of return that offer something quite different from the standard-issue trackers.
For instance, the main indexes such as the MSCI World and S&P 500 are dominated by Large Cap firms. Beyond that, they’re also heavily coloured by the tech sector.
Whereas some Smart Beta strategies specialise in Small Caps or stocks with traits which aren’t typically found in the tech sector.
So if you’d like to add a contrarian tilt to your portfolio then Small Value, Small Caps and Low Vol ETFs offer useful ways to do it.
Consider pairing those choices with a complementary Smart Beta strategy or look into the Multi-Factor options for instant diversification across the board.
You can find Smart Beta ETFs by using the Equity Strategy drop-down menu of our ETF screener.
The following strategies all count as Smart Beta: