Brand awareness counts, and that’s as true for the stock markets of London, New York, Paris and Milan as it is for the fashion houses. When ETF managers partner up their products with an index provider, the evidence is that they choose the big name. Look at the critical developed world category. The MSCI World index utterly dominates the field: with 20 MSCI World ETFs (as of June 2023) lining up against three FTSE Developed World ETF (not including factor or sector tilts).
MSCI is also the go-to index provider in the emerging markets space: 20 to 3 vs FTSE for vanilla ETFs.
It’s only once you drill down into regions and countries that other index providers such as STOXX, S&P and even FTSE play a significant role. Despite MSCI’s global dominance, there is little obvious difference between their offering and FTSE’s: both offer broadly diversified, market capitalisation-weighted indices. But the devil is in the detail and you can only flush that out with a deep-dive into the two providers’ index methodologies.
MSCI Vs FTSE: the differences
The biggest discrepancy between the two index providers is whether they count certain countries as developed or emerging markets. For example, South Korea is classified as an emerging nation by MSCI but has been promoted to developed market status by FTSE. Therefore, South Korea is included in FTSE’s developed market index but not its emerging market one, and vice versa for MSCI. Meanwhile, Poland was upgraded to developed status by FTSE in 2018, whereas MSCI still remains unpersuaded – leaving Poland in its emerging market league for now.
Another difference can be seen in the way the Chinese shares are handled: Since June 2018, MSCI has included A shares in the emerging markets index in addition to H and B shares, which for a long time were only accessible to Chinese investors. Inclusion is at 20 % of market capitalisation and is limited to stocks that can be bought by foreign investors.
FTSE also included Chinese A-shares in its emerging market index at a portion of market capitalisation in June 2019 and has since increased the share to 25 % of market capitalisation. This makes China by far the most represented country in both emerging market barometers, although no more than a quarter of the actual market capitalisation of Chinese domestic stocks is counted for this purpose.
The contrast in index composition is clearer in the emerging markets because South Korea makes a big difference at this level. It’s the fourth-largest country in the MSCI Emerging Markets Index and so its absence in the FTSE index tends to concentrate its holdings in the other major players.
Small-cap firms cause another material difference between the indices. MSCI global indices capture 85% of the investable universe by market cap and exclude the bottom 15% as small-cap firms. But FTSE global indices track 90% of market capitalisation and exclude the bottom 10% as small-cap firms. Essentially, FTSE scoops up some companies that MSCI define as small-cap, which explains why FTSE indices usually contain more companies.
Although more companies are included in the FTSE indices, their relatively small size tends to limit their impact.
MSCI Vs FTSE: performance
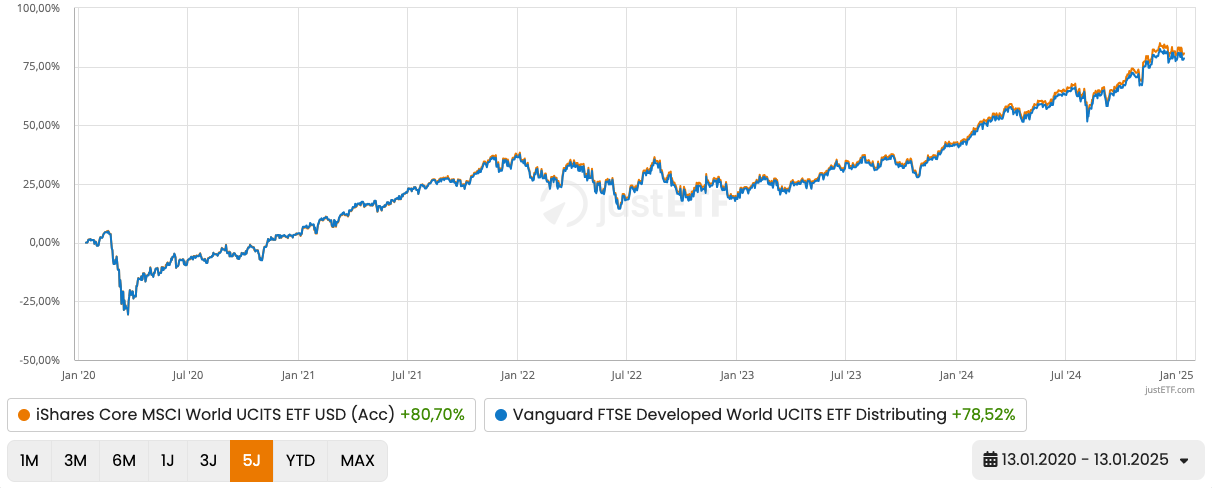
The performance difference has been negligible between the MSCI World and FTSE Developed indices, as you can see in this comparison between popular ETFs that track the two.
Performance comparison: MSCI Vs. FTSE – Developed Markets (13/01/2020-13/01/2025)
Source: justETF Research; as of 14/01/2025
You can barely slip a sheet of paper between the results of Vanguard’s FTSE Developed World ETF and iShares MSCI World ETF as the differences in index composition aren’t enough to noticeably move the needle.
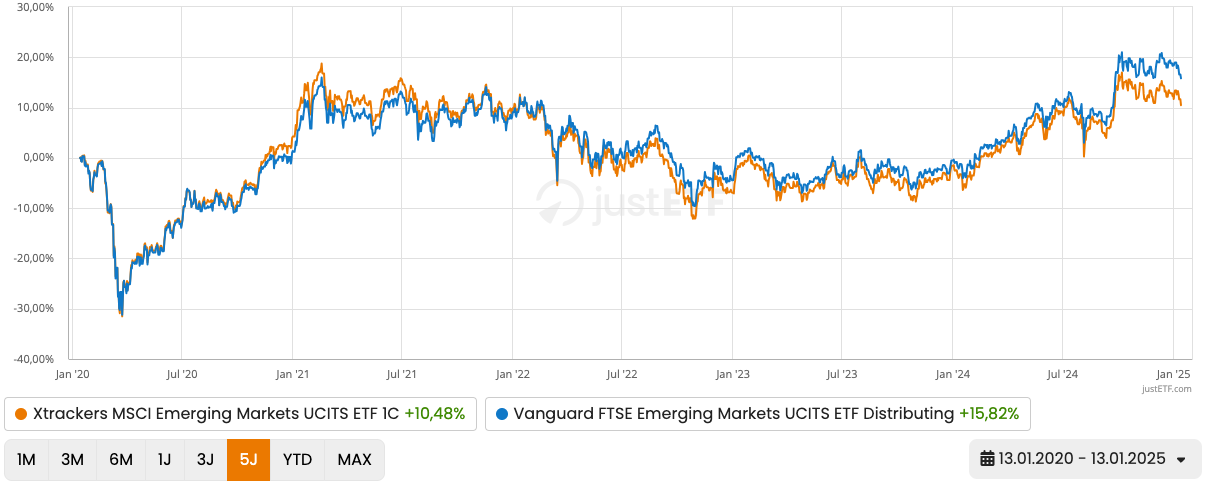
But the same is not true for the emerging markets. Since launch, the Vanguard FTSE Emerging Markets ETF (+56,75%) has outperformed the iShares ETF MSCI Emerging Markets ETF (+48,75%). Of course, there’s no reason to believe that FTSE’s advantage will hold over the long run. MSCI could overhaul FTSE if future results unfold in favour of its emerging market index composition. For example, if South Korea overperformed relative to other holdings in its index.
MSCI Vs. FTSE – Emerging Markets (13/01/2020 - 13/01/2025)
Source: justETF Research; as of 14/01/2025
Small deviations in index construction may make a bigger difference at the regional or country level. This is where paying close attention to different index methodologies can pay off. For example, how much small-cap exposure do you get? What mix of share classes is a China ETF exposed to? Are you tracking a total stock market index which is less likely to saddle your ETF with dealing costs due to constituent company turnover?
What does that mean in concrete terms?
The broader your index, the more likely it is to deliver comparable results to its rivals over the medium and long-term. And you can’t get broader than a global ETF so focus on the cost of the product here rather than the finer details of index construction. But: The cheapest MSCI World ETF currently sports a Total Expense Ratio (TER) of 0.12 %. That’s exactly the same TER as of the two FTSE Developed ETF. Contrary, the cheapest MSCI Emerging Markets ETF costs 0.14 %, while the FTSE Emerging ETF costs 0.22 %.
The situation is reversed among All-World products that combine developed and emerging markets in a single index. The FTSE All-World ETF costs 0.22 % versus 0.20 % for the cheapest MSCI All-Country World ETF.
However, try to avoid mixing index providers in your portfolio at the broad market level. For example, if you combine an MSCI World ETF with a FTSE Emerging ETF, then you won’t have any exposure to South Korea or Poland. Meanwhile, you’ll hold both those markets twice if you take the FTSE Developed World ETF along with an MSCI Emerging Markets ETF.
MSCI World Index vs FTSE Developed Index in detail
Apple (5.45 %)
Nvidia (4.72 %)
Microsoft (4.26 %)
Amazon (2.79 %)
Meta (1.83 %)
Apple (5.07 %)
Nvidia (4.45 %)
Microsoft (4.44 %)
Amazon (2.91 %)
Meta (1.82 %)
Source: MSCI World, FTSE Developed; as of 31/12/2024
FAQs: MSCI vs. FTSE
MSCI ACWI or FTSE All World?
The question of which of the two global equity indices is better comes up often. While the MSCI All Country World Index (MSCI ACWI for short) covers about 85 % of the world's market capitalisation, the FTSE All World manages about 90 %. Both indices invest in both developed and emerging market equities and focus on large and mid-caps.
Both indices are ideally suited and a perfect "all-in-one" solution for those who only want to have one ETF in their custody account or are just starting out with ETFs.
Which ETF is better than the MSCI World??
There is no such thing as "better" or "worse" in the true sense of the word. Nevertheless, it should be noted that the MSCI World is not a fully comprehensive world index - because the more than 20 emerging markets around China, India and Co. are missing from the MSCI World.
So if you really want to invest globally, you should either add an emerging markets index or go for a truly globally diversified world index like the MSCI ACWI or FTSE All-Word. In the latter two, both the industrialised and the emerging countries are included.
How good is the Vanguard FTSE All World?
ETFs on the FTSE All World Index are an excellent way to invest in a globally diversified way. Even if people in this country know MSCI or iShares better than FTSE and Vanguard, there is nothing to say against betting on the MSCI ACWI's counterpart, the FTSE All World.
Both indices invest in almost the same stocks and consequently have very similar returns. The index contains about 9,000 different stocks. In the end, it's like ice cream from the ice cream parlour - if you prefer chocolate ice cream, go for chocolate - if you prefer vanilla ice cream, go for vanilla.
Which ETF is the most broadly diversified??
Contrary to what you might think, it is not the well-known MSCI World that is the most broadly diversified in the stock market. This is because the MSCI World only contains shares from industrialised countries such as the USA or Japan.
If, on the other hand, you prefer the broadest possible diversification, you go for global indices from industrialised and emerging countries such as the MSCI ACWI or the FTSE All World. This covers about 90% of the market capitalisation.
If you like it even broader, you should add small caps to the large and mid caps. These are included in the MSCI ACWI IMI. The counterpart from Vanguard is called FTSE All Cap - but this is only available as a sustainable ESG variant.
Stay up to date
Free English newsletter including the latest news & knowledge about investing in ETFs.