Your selection basket is empty.
Define a selection of ETFs which you would like to compare.
Add an ETF by clicking "Compare" on an ETF profile or by checkmarking an ETF in the ETF search.
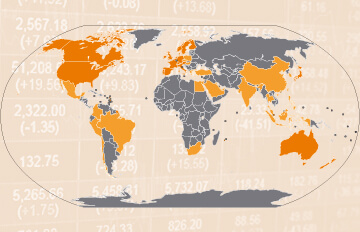
The MSCI All Country World Index (MSCI ACWI) is an international equity index, which tracks stocks from 23 developed and 24 emerging markets countries. This broad global index consists of the MSCI World (global index for developed countries) and the MSCI Emerging Markets (global index for emerging markets countries). However, emerging markets stocks are weighted with 12.18%, whereas stocks from developed markets account for 87.82%. With 2,461 constituents (as of 30/06/2026), the index covers approximately 85% of the free float-adjusted global market capitalization.
Stocks from the USA make up the biggest weight in the MSCI ACWI with 63.63%, followed by Japan (5.00%) and Taiwan (3.33%). Top sectors within the MSCI ACWI are information technology (32.09%), financial services (16.18%) and industrials (11.04%). Source: MSCI; As of 30/06/2026
ETF investors can benefit from price gains and dividends of the MSCI ACWI constituents. Currently, the MSCI ACWI index is tracked by 6 ETFs.
Source: justETF.com; As of 01.08.26; Performance in EUR, based on the largest ETF.
The total expense ratio (TER) of MSCI ACWI ETFs is between 0.06% p.a. and 0.20% p.a.. In comparison, most actively managed funds do cost much more fees per year. Calculate your individual cost savings by using our cost calculator.
| 1 | Scalable MSCI AC World Xtrackers UCITS ETF 1C | 27.53% | ||
| 2 | State Street SPDR MSCI All Country World UCITS ETF USD Unhedged (Acc) | 21.03% | ||
| 3 | iShares MSCI ACWI UCITS ETF USD (Acc) | 20.93% |
All MSCI ACWI ETFs ranked by fund return
| 1 | iShares MSCI ACWI UCITS ETF USD (Acc) | 29,494 m | ||
| 2 | State Street SPDR MSCI All Country World UCITS ETF USD Unhedged (Acc) | 14,683 m | ||
| 3 | Scalable MSCI AC World Xtrackers UCITS ETF 1C | 707 m |
All MSCI ACWI ETFs ranked by fund size
| 1 | BNP Paribas Easy MSCI ACWI UCITS ETF EUR (Acc) | 0.06% p.a. | ||
| 2 | iShares MSCI ACWI Swap UCITS ETF USD (Acc) | 0.12% p.a. | ||
| 3 | State Street SPDR MSCI All Country World UCITS ETF USD Unhedged (Acc) | 0.12% p.a. |
All MSCI ACWI ETFs ranked by total expense ratio
Besides return, there are further important factors to consider when selecting a MSCI ACWI ETF. In order to provide a sound decision basis, you find a list of all MSCI ACWI ETFs with details on size, cost, age, use of profits, fund domicile and replication method ranked by fund size.
Compare all MSCI ACWI ETFs in detail
Compare all MSCI ACWI ETFs in a chart
| ETF name ISIN | Fund size in m EUR | TER in % | Use of profits | Fund domicile | Replication method | |
|---|---|---|---|---|---|---|
| iShares MSCI ACWI UCITS ETF USD (Acc)IE00B6R52259 | 29,494 | 0.20% p.a. | Accumulating | Ireland | Optimized sampling | |
| State Street SPDR MSCI All Country World UCITS ETF USD Unhedged (Acc)IE00B44Z5B48 | 14,683 | 0.12% p.a. | Accumulating | Ireland | Optimized sampling | |
| Scalable MSCI AC World Xtrackers UCITS ETF 1CLU2903252349 | 707 | 0.15% p.a. | Accumulating | Luxembourg | Physical & Synthetic | |
| iShares MSCI ACWI Swap UCITS ETF USD (Acc)IE000CYC2B65 | 63 | 0.12% p.a. | Accumulating | Ireland | Unfunded swap | |
| BNP Paribas Easy MSCI ACWI UCITS ETF EUR (Acc)LU3243907741 | 55 | 0.06% p.a. | Accumulating | Luxembourg | Unfunded swap | |
| iShares MSCI ACWI UCITS ETF USD (Dist)IE0002FCUS29 | 19 | 0.20% p.a. | Distributing | Ireland | Optimized sampling |
Source: justETF.com; As of 01.08.26
The table shows the returns of all MSCI ACWI ETFs in comparison. All return figures are including dividends as of month end. Besides the return the reference date on which you conduct the comparison is important. In order to find the best ETFs, you can also perform a chart comparison.
| ETF | 1 month in % | 3 months in % | 6 months in % | 1 year in % | 3 years in % | |
|---|---|---|---|---|---|---|
| Scalable MSCI AC World Xtrackers UCITS ETF 1C | 1.37% | 18.13% | 14.26% | 27.53% | - | |
| State Street SPDR MSCI All Country World UCITS ETF USD Unhedged (Acc) | -1.43% | 5.63% | 11.44% | 21.03% | 58.21% | |
| iShares MSCI ACWI UCITS ETF USD (Acc) | -1.40% | 5.67% | 11.49% | 20.93% | 57.87% | |
| BNP Paribas Easy MSCI ACWI UCITS ETF EUR (Acc) | 1.35% | 18.09% | - | - | - | |
| iShares MSCI ACWI Swap UCITS ETF USD (Acc) | -1.50% | 5.52% | - | - | - | |
| iShares MSCI ACWI UCITS ETF USD (Dist) | -1.85% | 5.08% | 10.91% | - | - |
| ETF | 2026 in % | 2025 in % | 2024 in % | 2023 in % | 2022 in % | |
|---|---|---|---|---|---|---|
| Scalable MSCI AC World Xtrackers UCITS ETF 1C | 13.82% | 8.51% | - | - | - | |
| iShares MSCI ACWI UCITS ETF USD (Acc) | 12.40% | 8.22% | 24.82% | 18.11% | -13.12% | |
| State Street SPDR MSCI All Country World UCITS ETF USD Unhedged (Acc) | 12.33% | 8.58% | 24.83% | 17.77% | -13.24% | |
| iShares MSCI ACWI UCITS ETF USD (Dist) | 11.42% | - | - | - | - | |
| BNP Paribas Easy MSCI ACWI UCITS ETF EUR (Acc) | - | - | - | - | - | |
| iShares MSCI ACWI Swap UCITS ETF USD (Acc) | - | - | - | - | - |
Source: justETF.com; As of 31.07.26; Calculations in EUR including dividends

