Many investors ask themselves this question. We show you how to think about your personal risk tolerance and put together the portfolio that suits you best
"Past performance is not a reliable indicator of future performance." This boilerplate warning, slapped on every key investor document, is a reminder that investing always involves risk and that past returns can’t just be assumed to continue uninterrupted.
Historical returns can help guide strategic asset allocation
But while history doesn’t repeat, we know that it often rhymes. We know that past returns contain information about risk, and can help us make strategic portfolio decisions – just as meteorological data tells us something about our country’s climate even though we can’t accurately forecast next week’s weather.
Long-term data helps us tease out the broad characteristics of each asset class and can be used to assess the balance of risk and return in model portfolios.
Armed with our working assumptions, we can use this knowledge to customise our own portfolios to suit our expected returns, individual risk tolerance, and time horizon.
Historical performance comparisons reveal a great deal
We can learn a lot about past asset allocation sweet spots by matching up high-risk and low-risk portfolios against each other.
You can see how this plays out when we drill into the performance of a 100% global equity portfolio based on the MSCI World Index versus a 100% German government bond portfolio.
Our comparison assumes:
When we run the numbers, the simulation highlights sharp differences in volatility and performance between equities and bonds:
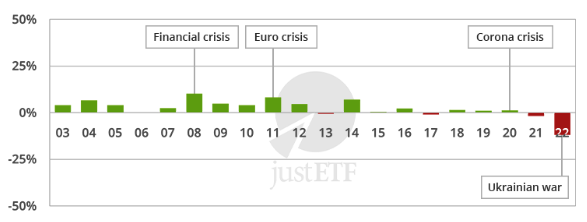
Annual return on a bond-only portfolio from 2003 to 2022 / Equity allocation of 0%
Source: justETF Research; as of 30/11/23
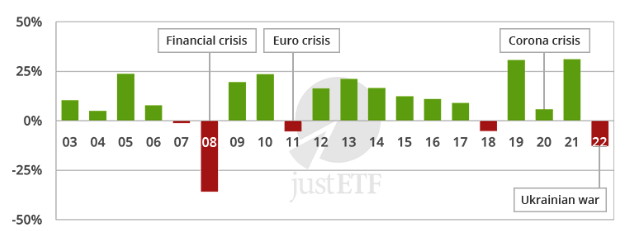
Annual return on a equity-only portfolio from 2003 to 2022 / Bond allocation of 0%
Source: justETF Research; as of 30/11/23
Bonds were our steady Eddies during the period. They provided moderate returns overall, and often registered a good performance when equities were under the hammer – witness the Financial Crisis of 2007-2008, the Euro Crisis of 2011, and the 2018 global stock market downturn.
That said, bonds aren’t guaranteed to counteract a fall in stocks. Both assets dropped around 12% in 2022 as inflation pressures took their toll.
But negative years for bonds are typically very mild in comparison to equities. The three worst results for bonds over the period were -1% in 2017, -1.7% in 2021, and -11.9% in 2022. The top three setbacks for equities were -35.8% in 2008, -5.2% in 2011, and -12.6% in 2022.
While bonds offer stability, equities are the drivers of growth. Stocks routinely posted double-digit annual gains from 2003 to 2022. See 2019’s 30.8% and 2021’s 31.1%. But there’s a price to pay for those euphoric advances. Stocks are described as risky for a reason and the risk materialised with that dramatic plunge in 2008. Frequent downturns go with the territory when you invest in stocks – as the red bars in the graphic show.
Most people offset that risk by diversifying a portion of their holdings into government bonds.
Despite its volatilty, the 100% equity portfolio still notched an annualised return of 8.0% versus 2.3% for the 100% bond portfolio.
The tale of the ticker tape also illustrates how important the holding period is when seeking to capitalise on the long-term performance of equities. In 2020, investors experienced this process in fast forward. The record-breaking Corona crisis crash was followed by an equally rapid recovery, so that equities produced an even higher return than bonds over the year – as long as you kept calm and stayed invested during the panic.
Controlling risk
Our next table clearly demonstrates the relationship between risk and reward. To reap the higher expected returns of equities you must deal with periods of wild volatility and sometimes significant losses.
To illustrate, we compared the annualised return and maximum drawdown for 11 portfolios with equity allocations ranging from 0% to 100%.
Simulation of annual return from 2003 to 2022 for various equity allocations with a risk of 0 to 100%
Equity allocation
0%
10%
20%
30%
40%
50%
60%
70%
80%
90%
100%
Annualised return
2.3%
3.0%
3.7%
4.3%
4.9%
5.5%
6.1%
6.6%
7.1%
7.5%
8.0%
Maximum drawdown
-14.5%
-12.1%
-12%
-12.1%
-15.5%
-21.6%
-27.4%
-33.1%
-38.6%
-44%
-49.1%
Best year
10.1%
8.1%
9%
10%
13%
16%
18.9%
21.9%
24.9%
27.9%
31.1%
Worst year
-11.9%
-11.9%
-12%
-12.1%
-12.2%
-12.6%
-17.4%
-22%
-26.6%
-31.2%
-35.4%
Source: justETF Research; as of 30/11/23
Maximum drawdown is defined as the largest loss within a single calendar year.
Each equity:bond portfolio is rebalanced annually.
justETF tip: You can also investigate this comparison using our Strategy Builder tool.
As you can see, the higher the equity allocation, the higher a portfolio’s annualised return. But the flip side of concentrating in equities is enduring the steeper losses shown in the maximum drawdown and worst year rows of the table. And therein lies the dilemma.
Earning an 8% average annualised return from a 100% equity portfolio over twenty years is an excellent result. But to make those returns you had to deal with your wealth being cut almost in half during the Global Financial Crisis (see that year’s -49.1% maximum drawdown).
Some people aren’t concerned about that level of volatility. They can ignore paper losses because they expect the market will rebound eventually. They don’t check their portfolio very often. And they aren’t ever tempted to sell when the market slides. They just hunker down and keep their money invested for as long as is required to rideout the storm.
Others are much more sensitive to the trials and tribulations of the stock market. They find it psychologically painful to watch the value of their portfolio fall dramatically. They’re unnerved by hype-laden news reports portraying common stock market reversals as a “rout” or “slaughter”. In the worst-case scenario, some may feel their wealth is endangered. They panic and sell their equities as prices hit rock bottom. Now they have locked-in their loss and may struggle to recover if they mistime the market recovery.
Most people sit somewhere along the risk tolerance spectrum between total imperviousness to stock market pain and extreme sensitivity. Your individual tolerance is something you will only learn by experiencing a market knockback once you have real money invested or ‘skin in the game’.
You might be able to tolerate a 30% decline without breaking a sweat. But 50% could be too much. Losses can go higher still before the turnaround kicks in.
The point of bonds – as you can see from the table – is to take the edge off drops in the value of equities. The less comfortable you are with stock market risk, the more bonds you should own.
For example, a 60:40 equity:bond portfolio earned a respectable 6% a year but also cut the maximum drawdown figure by almost half to -27% in our sample period versus the 100% equity portfolio’s -49.1%.
With a 60:40 asset allocation, your portfolio grew at a more moderate pace in exchange for less volatility. This can be a very sensible trade-off, especially as your wealth builds into a substantial nest egg.
The right balance of equities and bonds is a very personal decision. There is no right or wrong, especially as even a 20-year period of historical data cannot predict the precise outcome of the next period.
However, sampling the past gives us some idea of what to expect in the future.
100% equities is likely to be the best-performing but most volatile portfolio over the long-term.Bond heavy portfolios cut your exposure to the risk of volatility (i.e. great swings in fortune) but at the expense of future returns.
Yet as the table also shows, the respective advantages of equities and bonds tend to flatten out at the polar extremes of asset allocation.
Choosing a 100% equity portfolio may eke out a fraction more return but at the cost of accepting proportionally more risk. While the loss of long-term return associated with a 100% bond portfolio may not be compensated for by an appreciable reduction in risk.
While our simulation is only a snapshot from a deeper historical record, it reveals patterns that repeat time and again:
Diversification across equities and bonds typically provides a better risk-reward ratio than investing 100% in either asset class alone.
Equities provide handsome returns during boom times. Bonds can cushion losses during downturns.
The role of rebalancing
Rebalancing is a risk management technique used to ensure your portfolio continues to reflect your risk tolerance over time. Rebalancing prompts you to periodically realign your positions with your original asset allocation.
A happy side-effect of this move is that it sometimes boosts performance: an outcome known as the ‘rebalancing bonus.
But rebalancing actually reduced returns marginally between 2003 and 2022, as shown in the next table:
With and without rebalancing (annualised returns 2003 - 2022)
Equity allocation
0%
10%
20%
30%
40%
50%
60%
70%
80%
90%
100%
With rebalancing
2.3%
3.0%
3.7%
4.3%
4.9%
5.5%
6.1%
6.6%
7.1%
7.5%
8.0%
Without rebalancing
2.3%
3.2%
4.0%
4.7%
5.3%
5.8%
6.3%
6.8%
7.2%
7.6%
8.0%
Rebalancing bonus
0.0%
-0.2%
-0.3%
0%
-0.4%
0.3%
0.2%
0.2%
0.1%
0.1%
0.0%
Source: justETF Research; as of 30/11/23
Rebalancing costs not included. 100% equities and 100% bond portfolios are not rebalanced.
For example, the 60:40 portfolio earned a 6.3% annualised return without rebalancing and a 6.1% return with.
That said, the worst year and maximum drawdown numbers were also higher for the non-rebalanced portfolio as its equity weight drifted higher across the period because stocks outperformed bonds.
Again, rebalancing’s purpose is to control risk. It’s designed to stop a 60:40 portfolio becoming a 70:30 or 80:20 portfolio if equities go on a tear. Why’s that a problem? Because if stocks go into bubble territory and then crash, you can suddenly find yourself well beyond your risk tolerance comfort zone and holding too many equities if the market craters after a run-up.
The small price to pay for rebalancing is worth it if it spares you from panicking and selling at the wrong time in a crisis.
Intriguingly, the 60:40 portfolio earned a 0.5% rebalancing bonus between 2001 and 2020, so you can see that the performance differential can flip quite quickly depending on the period sampled.
Asset allocation history lesson
This is a relatively simple simulation but it shows we can learn a lot from history. By observing asset class behaviour across the years, we can draw empirical conclusions about the general characteristics of our investments. From that vantage point, we can then make more informed decisions about how to weight our portfolios to suit our personal risk tolerance and expected return requirements.
Find out more in our beginners guide to portfolio strategies.