De beste effectenrekeningen voor ETF's 10/2026
Alle brokers getest op basis van objectieve criteria – Wie zijn de winnaars?
Monthly savings rate:

L&G Emerging Markets Corporate Bond (USD) Screened UCITS ETF USD Dist

ISIN IE00BLRPRF81

 | 

Ticker EMAB

TER
0,35% p.a.
Distributiebeleid
Distribución
Replicatie
Física
Fondsgrootte
EUR 75 m
Startdatum
21 de enero de 2021
Bedrijven
599
Advertisement
Je kapitaal loopt risico. Meer informatie en voorwaarden op trading212.com
 

Overzicht

Verhandel deze ETF bij je broker

Kies uw broker
Advertisement
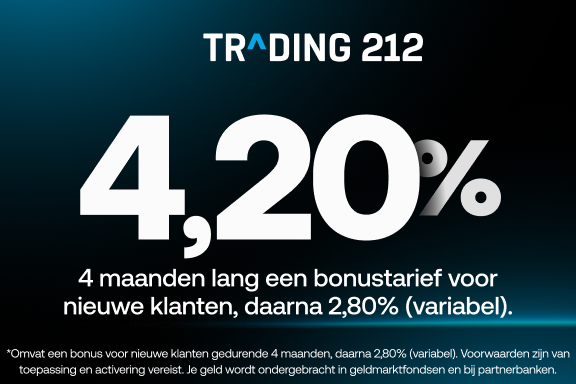
Trading212Beleg met Trading 212: 4,20 % rente op euro's en beleg in 12.000+ aandelen & ETF's. Account openen*
Je kapitaal loopt risico. Meer informatie en voorwaarden op trading212.com

Beschrijving

El L&G Emerging Markets Corporate Bond (USD) Screened UCITS ETF USD Dist replica el índice JP Morgan ESG CEMBI Broad Diversified Custom Maturity. The JP Morgan ESG CEMBI Broad Diversified Custom Maturity index tracks ESG (environmental, social and governance) screened, USD denominated bonds issued by companies from emerging markets. All maturities are included. Rating: Mixed.
 
The ETF's TER (total expense ratio) amounts to 0,35% p.a.. The L&G Emerging Markets Corporate Bond (USD) Screened UCITS ETF USD Dist is the cheapest and largest ETF that tracks the JP Morgan ESG CEMBI Broad Diversified Custom Maturity index. The ETF replicates the performance of the underlying index by sampling technique (buying a selection of the most relevant index constituents). The interest income (coupons) in the ETF is distributed to the investors (Semestral).
 
The L&G Emerging Markets Corporate Bond (USD) Screened UCITS ETF USD Dist is a small ETF with 75m Euro assets under management. The ETF was launched on 21 januari 2021 and is domiciled in Irlanda.
Toon meer Toon minder

Grafiek

Basis

Data

Index
JP Morgan ESG CEMBI Broad Diversified Custom Maturity
Investeringsfocus
Bonos, USD, Mercados emergentes, Deuda corporativa, Todos los vencimientos, Social/Medioambiental
Fondsgrootte
EUR 75 m
Totale kostenratio (TER)
0,35% p.a.
Replicatie Fysiek (Sampling)
Juridische structuur ETF
Beleggingsaanpak Langdurig
Duurzaamheid Sí
Valuta van het fonds USD
Valutarisico Valuta niet gedekt
Volatiliteit 1 jaar (in EUR)
5,14%
Startdatum/Noteringsdatum 21 de enero de 2021
Distributiebeleid Distribueren
Distributiefrequentie Halfjaarlijks
Vestigingsplaats van het fonds Irlanda
Fondsaanbieder Legal & General (LGIM)
Duitsland Sin rebaja de impuestos
Zwitserland Informe ESTV
Oostenrijk Fondo de declaración de impuestos
UK Informes del Reino Unido
Italië 25,8%
Indextype Totale rendementsindex
Swap tegenpartij -
Collateral manager BNY Mellon Fund Services (Ireland) Limited
Effectenlening Yes
Tegenpartij die effecten uitleent

Vergelijkbare ETF

In dit gedeelte vind je informatie over andere ETF met een vergelijkbare beleggingsfocus als de L&G Emerging Markets Corporate Bond (USD) Screened UCITS ETF USD Dist
Vergelijkbare ETF via ETF zoeken
Advertisement
Trading212
Beleg met Trading212
4,20 % rente op euro's en beleg in 12.000+ aandelen & ETF's.
Account openen
Je kapitaal loopt risico. Meer informatie en voorwaarden op trading212.com
Wat vind je van ons ETF-profiel? Here you'll find our Questionnaire.

Holdings

Below you find information about the composition of the L&G Emerging Markets Corporate Bond (USD) Screened UCITS ETF USD Dist.

Countries

Hong Kong
11,76%
Emiratos Árabes Unidos
8,41%
Brasil
6,68%
México
6,24%
Otros
66,91%
Show more

Sectors

Finanzas
44,10%
Materiales no energéticos
11,74%
Energía
10,72%
Servicios públicos
7,23%
Otros
26,21%
Show more
As of 27/8/26

ETF Savings plan offers

Aquí encontrarás información sobre la disponibilidad del plan de inversión del ETF. Puedes usar la tabla para comparar todos los planes de inversión ofertados para la cantidad de ahorro seleccionada.
 
Broker Rating Execution fee Account fee
0,00 €
0,00 €
0,00 €
0,00 €
Bekijk aanbod*
0,00 €
0,00 €
Gedetailleerde vergelijking van alle aanbiedingen
Bron: justETF Research; Vanaf 10/2026. De aanbiedingen zijn als volgt gesorteerd: 1. Rating 2. Kosten beleggingsplan 3. Aantal ETF-beleggingsplannen. Er kan geen garantie worden gegeven voor de volledigheid en juistheid van de vermelde informatie. De informatie van de online brokers is doorslaggevend. Naast de aangegeven makelaarskosten kunnen extra kosten (bijv. spreads, fooien en productkosten) van toepassing zijn.
*Affiliate link
** Belangrijke opmerking: Sinds 2021 maken wij deel uit van de Scalable-groep en zijn wij een 100% dochteronderneming van Scalable AG. Hierdoor zijn wij economisch verbonden, maar redactioneel onafhankelijk. Belangenconflicten worden vermeden, omdat brokers – inclusief Scalable – worden beoordeeld volgens uniforme, objectieve criteria. Want uiteindelijk moet jij zelf beslissen hoe en bij wie je wilt beleggen.

Performance

Las cifras de rentabilidad incluyen las distribuciones/dividendos (si los hay). Por defecto, se muestra el rendimiento total del ETF.

Returns overview

YTD +4.14%
1 month +1.22%
3 months +0.00%
6 months +3.35%
1 year +3.60%
3 years +14.74%
5 years +11.54%
Since inception (MAX) +16.67%
2025 -4.39%
2024 +12.44%
2023 +3.51%
2022 -6.17%

Monthly returns in a heat map

Dividends

Current dividend yield

Rentabilidad actual de los dividendos 5,60%
Dividends (last 12 months) EUR 0,42

Historic dividend yields

Period Dividend in EUR Dividend yield in %
1 Año EUR 0,42 5,49%
2025 EUR 0,44 5,26%
2024 EUR 0,40 5,08%
2023 EUR 0,36 4,60%
2022 EUR 0,30 3,46%

Dividend yield contribution

Monthly dividends

Risk

Risk metrics in this section:
 
  • Volatility, annualised, measured for 1, 3 and 5 year periods. The annualised volatility reflects the degree of price fluctuations during a one year period. The higher the volatility, the more significantly the price of the asset (stock, ETF, etc.) has changed in the past. Assets with higher volatility are generally considered more risky. We calculate the volatility based on the data for the past 1, 3 and 5 years so that you can see if price fluctuations for the ETF became stronger or weaker over time.
  • Return per risk for 1, 3 and 5 year periods. This is the annualised (i.e. converted to a one year period) past return divided by the past annualised volatility. The metric puts the historical return of an asset in relation to its historical risk and gives you a retrospective indication of the degree of price fluctuation you had to bear with in order to obtain the return. We calculate this parameter for 1, 3 and 5 year periods to display its evolution over time.
  • Maximum drawdown for a period. This shows the worst possible loss an investor could have suffered during the respective period, by first buying and subsequently selling the asset at the least favourable prices. For example, if there was the following sequence of daily ETF prices: 10€, 5€, 12€, 20€, an investor would have suffered the worst loss by buying for 10€ and subsequently selling for 5€. Therefore in this case the maximum drawdown would be (5€ - 10€)/10€ = -50%.
ETF returns include dividend payments (if applicable).
Show more Show less

Risk overview

Volatility 1 year 5.14%
Volatility 3 years 6.97%
Volatility 5 years 7.72%
Return per risk 1 year 0.70
Return per risk 3 years 0.67
Return per risk 5 years 0.29
Maximum drawdown 1 year -3.19%
Maximum drawdown 3 years -10.59%
Maximum drawdown 5 years -10.59%
Maximum drawdown since inception -10.59%

Rolling 1 year volatility

Stock exchange

Listings

Listing Trade Currency Ticker Bloomberg /
iNAV Bloomberg Code
Reuters RIC /
iNAV Reuters
Market Maker
gettex EUR EMAB -
-
-
-
-
Borsa Italiana EUR EMUS EMUS IM
EMABEUIV
EMUSE.MI
Flow Traders B.V.
London Stock Exchange GBX EMUG EMUG LN
NA
EMUG.L
NA
Flow Traders B.V.
London Stock Exchange USD EMUS EMUS LN
NA
EMUS.L
NA
Flow Traders B.V.
SIX Swiss Exchange CHF EMUS EMUS SW
EMABEUIV
EMUSG.S
Flow Traders B.V.
Xetra EUR EMAB EMAB GY
EMABEUIV
EMAB.DE
Flow Traders B.V.

Meer informatie

Verdere ETF op de JP Morgan ESG CEMBI Broad Diversified Custom Maturity-index

Naam fonds Fondsgrootte in €m (AuM) TER p.j. Distributie Replicatiemethode
L&G Emerging Markets Corporate Bond (USD) Screened UCITS ETF USD Acc 20 0,35% p.a. Accumulerend Sampling

Veelgestelde vragen

What is the name of EMAB?

The name of EMAB is L&G Emerging Markets Corporate Bond (USD) Screened UCITS ETF USD Dist.

What is the ticker of L&G Emerging Markets Corporate Bond (USD) Screened UCITS ETF USD Dist?

The primary ticker of L&G Emerging Markets Corporate Bond (USD) Screened UCITS ETF USD Dist is EMAB.

What is the ISIN of L&G Emerging Markets Corporate Bond (USD) Screened UCITS ETF USD Dist?

The ISIN of L&G Emerging Markets Corporate Bond (USD) Screened UCITS ETF USD Dist is IE00BLRPRF81.

What are the costs of L&G Emerging Markets Corporate Bond (USD) Screened UCITS ETF USD Dist?

The total expense ratio (TER) of L&G Emerging Markets Corporate Bond (USD) Screened UCITS ETF USD Dist amounts to 0,35% p.a.. These costs are withdrawn continuously from the fund assets and already included in the performance of the ETF. You don't have to pay them separately. Please have a look at our article for more information about the cost of ETFs.

What's the fund size of L&G Emerging Markets Corporate Bond (USD) Screened UCITS ETF USD Dist?

The fund size of L&G Emerging Markets Corporate Bond (USD) Screened UCITS ETF USD Dist is 75m Euro. See the following article for more information about the size of ETFs.

Track your ETF strategies online

— Data provided by Trackinsight, etfinfo, Xignite Inc., gettex, FactSet and justETF GmbH.

Quotes are either real-time (gettex) or 15 minutes delayed stock exchange quotes or NAVs (daily published by the fund provider). By default, ETF returns include dividend payments (if applicable). There is no warranty for completeness, accuracy and correctness for the displayed information.