Portfolio composition
The page “Asset allocation” gives you an overview of the current asset allocation of your portfolio and how your investment structure has changed over time.
Asset allocation over time
The pie chart on the left shows, at a glance, in which asset classes you are invested and what share they make up in your portfolio. Move the mouse over the outer edge of the pie chart to display the corresponding ETFs.
The graph on the right shows how your asset allocation has changed over time. Move the mouse over the graph to display the investment structure at a specific point in time.
![Asset allocation over time]()
This way, you can analyse at what time and with what share you were invested in an asset class, how your asset allocation has changed and whether rebalancing is appropriate under certain circumstances.
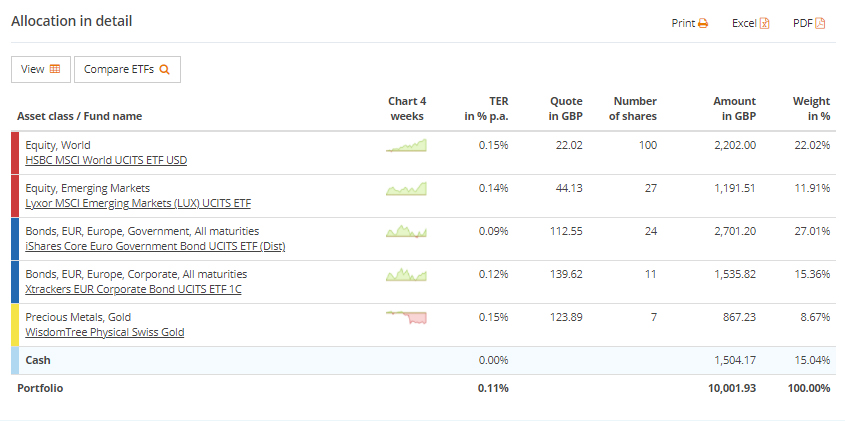
Asset allocation in detail
Below the graphs, you find a table with your current portfolio positions in detail. To learn more about the ETFs in your portfolio, simply move the mouse over the name of the ETFs in the table to get a short description, or click on the ETF name to go to the ETF profile.
![Asset allocation in detail]()
You can also print out the investment structure of your portfolio or download it as an Excel or PDF file. To do so, click on the corresponding button above the table on the right.
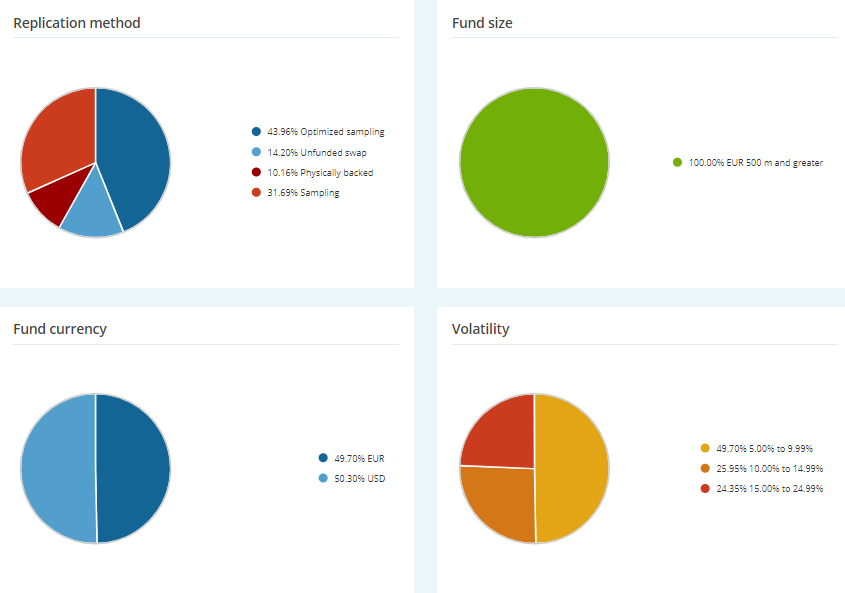
Below the table with the detailed view are additional pie charts that break down your current investment structure according to various criteria. This allows you to analyse the composition of your portfolio by replication method, fund size, ETF provider and other characteristics and key figures.
![Asset allocation in detail pie chart]()
Click on an individual pie slice to display all ETFs within your portfolio to which the corresponding attribute applies.
![Replication method]()