
The best Emerging Markets ETFs
How do I invest in stocks from Emerging Markets?
The easiest way to invest in Emerging Markets worldwide is to invest in a broad market index. This can be done at a low cost by using ETFs.
In this curated investment guide, you will find all ETFs that allow you to invest broadly diversified in Emerging Markets worldwide. Currently, there are 5 ETFs available.
The total expense ratio (TER) of ETFs tracking stocks from Emerging Markets is between 0,15% p.a. and 0,18% p.a..
0,15% p.a. - 0,18% p.a.
annual total expense ratio (TER) of emerging markets ETFs
tracking stocks from Emerging Markets, which are tracked by ETFs
that track a broadly diversified emerging markets index
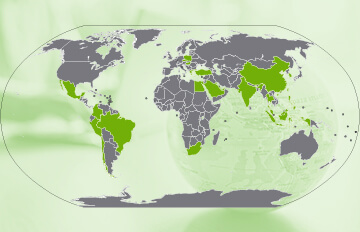
How do I invest in companies from emerging markets?
Investing in emerging markets worldwide can be very easy and cost-effective by using a single ETF that tracks a broadly diversified emerging markets index which is weighted by market capitalisation. Currently, the following indices can be considered for a globally diversified investment in emerging market equities:- FTSE Emerging
- FTSE Emerging ex China
- MSCI Emerging Markets
- MSCI Emerging Markets IMI
- MSCI Emerging Markets ex China
- WisdomTree True Emerging Markets UCITS
A worldwide emerging markets ETF is an excellent complement to a global developed markets ETF, like an MSCI World ETF. You can construct a globally diversified, yet simple and cost-efficient portfolio by combining two such ETFs. When using indices from different providers, you should make sure that none of the countries you want to cover is missing or included twice. You can ensure this by selecting two ETFs that track indices from the same provider. For more information on this topic, please have a look at our article MSCI Vs FTSE: Which is the best index provider?.
Alternatively, you may invest in a single World ETF that covers both developed and emerging markets.
In our ETF screener, you will find additional emerging markets ETFs, like sustainable emerging markets ETFs and dividend ETFs on emerging markets. In addition, you can monitor the performance of various emerging market indices with our market overview “ETF Emerging Markets”.
Performance of broadly diversified emerging markets indices in comparison
Source: justETF Research; As of 5/11/2026; Performance over 1 year in EUR.


Indices in comparison
Indices on stocks from Emerging Markets
The best indices for emerging markets ETFs
For an investment in stocks from Emerging Markets, there are 2 indices available that are tracked by 5 ETFs. The total expense ratio (TER) of ETFs on these indices is between 0,15% p.a. and 0,18% p.a.. Depending on the market environment, stocks from a single country can make up large parts of an index. You can find more information regarding the concentration of countries, companies and sectors in the index factsheets linked below.| Index | Investment focus | Number of ETFs | Number of constituents | Short description |
|---|---|---|---|---|
| FTSE Emerging | Opkomende markten | 2 ETFs | 2.290 (30/06/2026) | The FTSE Emerging index tracks stocks from emerging markets worldwide. Index factsheet |
| MSCI Emerging Markets | Opkomende markten | 3 ETFs | 1.165 (30/10/2026) | The MSCI Emerging Markets index tracks stocks from emerging markets worldwide. Index factsheet |
| Index | 1 month in % | 3 months in % | 6 months in % | 1 year in % | 3 years in % | 5 years in % |
|---|---|---|---|---|---|---|
| FTSE Emerging | -4,22% | -2,21% | 2,09% | 7,91% | 54,18% | 33,61% |
| MSCI Emerging Markets | -6,54% | -2,84% | 3,79% | 17,84% | 74,02% | 45,51% |
Source: justETF.com; As of 31/10/2026; Calculations in EUR based on the largest ETF of the respective index.
ETFs in comparison
ETFs tracking stocks from Emerging Markets
All emerging markets ETFs in comparison
In the table below we have listed the currently available emerging markets ETFs. Via the "Properties" and "Performance" tabs, you can find detailed information on these ETFs and sort them according to your desired criterion. More information about the different criteria when choosing an ETF can be found in our article on ETF selection.| ETF ISIN | Fund size in m EUR | TER in % | Inception date | Use of profits | Fund domicile | Replication method |
|---|---|---|---|---|---|---|
| iShares MSCI EM UCITS ETF (Dist)IE00B0M63177 | 8.285 | 0,18% p.a. | 18/11/2005 | Distribueren | Ierland | Volledige replicatie |
| Vanguard FTSE Emerging Markets UCITS ETF (USD) DistributingIE00B3VVMM84 | 3.022 | 0,17% p.a. | 22/05/2012 | Distribueren | Ierland | Volledige replicatie |
| UBS Core MSCI EM UCITS ETF USD disLU0480132876 | 2.613 | 0,15% p.a. | 12/11/2010 | Distribueren | Luxemburg | Geoptimaliseerde sampling |
| Vanguard FTSE Emerging Markets UCITS ETF (USD) AccumulatingIE00BK5BR733 | 2.163 | 0,17% p.a. | 24/09/2019 | Accumulerend | Ierland | Volledige replicatie |
| Amundi Core MSCI Emerging Markets UCITS ETF EUR DistLU1737652583 | 1.066 | 0,18% p.a. | 5/02/2018 | Distribueren | Luxemburg | Volledige replicatie |
| ETF ISIN | 1 month in % | 3 months in % | 6 months in % | 1 year in % | 3 years in % | 5 years in % |
|---|---|---|---|---|---|---|
| iShares MSCI EM UCITS ETF (Dist)IE00B0M63177 | -6,54% | -2,84% | 3,79% | 17,84% | 74,02% | 45,51% |
| Vanguard FTSE Emerging Markets UCITS ETF (USD) DistributingIE00B3VVMM84 | -4,22% | -2,21% | 2,09% | 7,91% | 54,18% | 33,61% |
| UBS Core MSCI EM UCITS ETF USD disLU0480132876 | -6,58% | -2,80% | 3,79% | 17,99% | 74,32% | 46,15% |
| Vanguard FTSE Emerging Markets UCITS ETF (USD) AccumulatingIE00BK5BR733 | -4,23% | -2,22% | 2,09% | 7,90% | 54,18% | 33,59% |
| Amundi Core MSCI Emerging Markets UCITS ETF EUR DistLU1737652583 | -6,58% | -2,91% | 3,58% | 17,59% | 73,20% | 44,61% |
Source: justETF.com; As of 31/10/2026