Have you ever wondered what market commentators mean when they say things like, “Valuations are stretched right now,” or “The US market looks very expensive”?
How do they know? What should we do about it? Do these warnings mean we should sell our equities to cash or execute some other defensive manoeuvre? Like Roman soldiers trained to hunker behind their shields when arrows rained down upon them?
Well, it is true that these warnings are often based on commonly accepted valuation metrics that anyone can check.
Like taking a blood test, these measures can be useful markers of health. They don’t tell us the market is going to have a heart attack tomorrow, but they can indicate when trouble is brewing.
The trick is to know what to look for and how much it can tell you. That’s what this article will help you do. So you know when to be concerned and when all this talk of “bubbly stock prices” and “frothy valuations” is just so much hand waving.
Price versus value
As investing legend Warren Buffett said, “Price is what you pay; value is what you get.”
Instinctively, we make this calculation all the time, whenever our inner voice asks: “Is this thing worth the money being asked for it?”
That’s a straightforward calculation when you have plenty of experience in buying the item. Or when the cost of making a mistake doesn’t matter much.
For example, a tin of baked beans with a fancy label generally isn’t worth many times the price of the supermarket’s own brand version. But expensive baked beans still sell because paying over the odds doesn’t seem likely to make much difference to anyone’s future wealth.
The price of financial assets, on the other hand, fundamentally affects your future wealth. Moreover, they’re much harder to value than a tin of beans.
The importance of a good price is contained within the investing maxim, “Buy stocks on sale”. Because if you can buy low, when people are shunning equities, you can sell high later - when the market recovers its collective nerve.
Conversely, if you buy overpriced stock, you run a greater risk of buying high and selling low. Taken to the extreme, that kind of behaviour leads to stock market bubbles and the pop that follows.
What does the data say?
The attraction of the valuation metrics is they incorporate business data that can help us understand if investments are:
Overvalued
Undervalued
Fairly valued
Like Goldilocks and the Three Bears, the judgement isn’t much more fine-grained than too hot, too cold, or just right.
Unlike Goldilocks, the valuation metrics rely on the fundamentals. The fundamentals are underlying company performance indicators, including:
Earnings and profitability - how much money the company makes
Revenue growth - whether sales are increasing
Assets and liabilities - what the company owns versus owes
Cash flow - actual cash generated by operations
So when you hear commentators say "the fundamentals are strong," they mean the company's actual business performance is solid - as measured by items such as growing sales, healthy profits, and manageable debt among others.
How do valuation metrics work?
The valuation metrics typically work by comparing a company's fundamentals with its stock price. Essentially, they create a bridge between business reality and market price.
For example, if a company’s earnings (profits) increased then you’d expect its stock price to rise too, as higher profits mean stronger returns for investors.
But if the stock price kept rising even when earnings did not, you might start to wonder if the company was overvalued and overhyped.
Other times, the fundamentals seem fine but the price drops anyway. Perhaps the market overreacts to bad news like the latest quarterly earnings are slightly lower than forecast.
In this scenario, the stock may be undervalued. That is, the company still has a bright long-term future, but it hasn’t delivered as fast as short-term investors hoped.
This kind of mismatch in expectations can create an opportunity for long-term investors who are more patient than other stockholders. The same also holds true for ETF investors who buy into entire markets.
The price-to-earnings metric
Let’s take a specific example. The Price-to-Earnings (P/E) ratio is a common stock valuation metric (it’s often published for many ETFs and indices, too).
‘P’ is for price and ‘E’ is for earnings per share.
The P/E ratio divides a stock’s current price by its earnings per share. A P/E of 20 means investors pay 20 € for every 1 € of annual earnings.
If the share price doubles, but profitability remains the same, then investors are willing to pay 40 € for every 1 € of annual earnings.
On the face of it, the company is now much more expensive. New shareholders are forking out more for its profits. Remember, “Price is what you pay; value is what you get.”
However, investors may be willing to pay that price because they reckon the company will be far more profitable in the years ahead. That is, they think the company is more valuable than its current fundamentals suggest and that increased future earnings will return their money at a faster rate than forty times earnings.
For example, perhaps the firm is an innovative AI company with a great product line-up. Hence, its investors may believe the company has the potential to grow its profits more rapidly than expected.
If the optimists are right, then the company will prove undervalued and they’ll earn strong returns.
If they’re wrong, the company will prove overvalued and they’ll earn weaker returns. If they’re very wrong, they’ll make a loss.
If the price is about right, then the company is fairly valued and set to deliver returns in line with current expectations.
(In reality, stock prices and business fundamentals constantly change as new data comes in. The above is a necessarily simplified illustration of the dynamics in play.)
Lower P/E ratios indicate that a company’s future earnings potential is more limited. Investors may believe its growth prospects are stagnant. Or they may be concerned about the risk of anticipated profits failing to materialise. Perhaps the firm’s entire industry is dying and the same trend afflicts its competitors, too.
The lack of perceived opportunity caps how much investors are willing to pay for earnings. Caution rules.
All the same, you can still find bargains among low P/E companies. Like raking through items at a car boot sale, you may turn up some hidden gems.
Perhaps the stock has been oversold and management has a turnaround plan that’s likely to increase the firm’s profitability. In this case, the stock could be undervalued and may deliver outsized returns if the firm defies expectations.
To sum up:
High valuations imply optimism. Investors expect strong growth or are relatively sure future earnings will materialise. The danger is that the optimism isn’t justified.
Low valuations imply pessimism, lack of opportunity, or heightened risk. If the gloom is overdone, then you may grab yourself a bargain. Unfortunately, a bad situation can always get worse.
It’s all relative
Valuation metrics don’t tell you anything in isolation. A particular number isn’t inherently good or bad in all markets. Hence, investors use peer comparisons and historical norms to contextualise the data.
For example, the S&P 500’s mean P/E ratio is around 16. Its current reading is 31 (3 October 2025). The ratio has previously exceeded that number on three separate occasions - all of which were followed by sharp market declines.
This helps explain why some commentators believe the S&P 500 looks expensive. Prices look high relative to earnings when compared to past valuation levels.
Think of it like measuring the height of a river that’s prone to bursting its banks. If you took a reading on a stormy night, and the river had previously flooded 8 out of 10 times when the water level was that high… Well, it may be time to issue a flood warning and distribute sand bags.
Of course, the rain may stop. You can’t be certain a flood will happen. But experience suggests that such an extreme reading is an ominous sign.
Bear in mind that valuation metrics vary widely across individual stocks, sectors, and markets. A P/E ratio of 31 may be unusually high for the S&P 500, but not for another index.
At the company level, you should compare with other stocks in the same sector. Meanwhile, an entire market can only be compared with its own history. This is analogous to the height of the Thames telling you next to nothing about the state of the Tay.
Common valuation metrics
Many investors layer up valuation metrics because no single indicator is particularly reliable by itself.
The following metrics are readily available at the ETF, index, or country level.
Metric / ratio
Formula
What it measures
Indicates
Limitations
Practical use
Price-to-Earnings (P/E)
Share Price / Earnings per Share (EPS)
How much investors are willing to pay for every euro of a company's annual profit.
High P/E is associated with the fear of missing out and overvaluationLow P/E is associated with the fear of losing out and undervaluation.
Earnings can be volatile, distorted by accounting rules, or temporarily inflated.
Compare against own history and peers. A high P/E is normal for tech stocks; a low P/E is normal for utilities.
Price-to-Book (P/B)
Share Price / Book Value per Share (Assets minus Liabilities)
How much investors are willing to pay for every euro of the company's net asset value.
P/B below 1 signals the company is worth less than the liquidation value of its physical assets. This can imply the firm is undervalued, or in distress.
Book value is an accounting measure that can be disconnected from economic reality. It’s most useful for firms whose physical assets are central to their value.
Relevant for asset-heavy sectors like banks, real estate firms, and industry. Less useful for tech companies where the value is in intangible assets such as IP, brand value, and network effects.
Dividend Yield (DY)
Annual Dividend per Share / Share Price
The return an investor receives in cash dividends, expressed as a percentage of the current share price.
High yields suggest mature companies that return capital to shareholders. Low yields suggest growth companies that retain profits to fund expansion.
Yield has a weak connection to value. High yields may be caused by falling prices. Low yields can indicate fast-growing tech firms that don’t pay dividends.
Higher yields may look attractive but can signal a struggling business or a share price in steep decline. Dig into the root cause.
CAPE ratio (Cyclically Adjusted Price-to-Earnings) or Shiller P/E
Current Price / Average Inflation-Adjusted Earnings over the past 10 years
Smooths out cyclical fluctuations (like recessions or booms) to offer better long-term valuations.
High CAPE correlates with lower average returns over the next 10 years. The inverse is true for low CAPE.
Markets can remain overvalued or undervalued for years, regardless of their CAPE ratio.
Only compare a CAPE ratio against a market’s own historical average.
Source: justETF Research; as of 14 October 2025
There are many more valuation metrics available, but the first three are most likely to be published by ETF providers. CAPE ratios are accessible for country and regional stock indices and tend to have higher predictive power than other measures.
How predictive are valuation metrics?
Unfortunately, the valuation metrics are poor market-timing tools. They tell you very little about short-term market moves over the course of a year or two.
However, some metrics are moderately predictive of longer-term returns.
Researchers have repeatedly shown that the CAPE ratio has a relatively strong relationship with subsequent 10 to 20 year returns.
High CAPE ratios indicate the market is expensive. They correlate with lower 10-20 year returns.
Low CAPE ratios indicate the market is cheap. They correlate with higher 10-20 year returns.
It’s important to recognise that stock markets are inherently unpredictable. Thus, CAPE is agonisingly imprecise. Its accuracy fluctuates both over time and by market.
For example, the CAPE ratio’s 10-year return predictive power has varied from 40 % to 90 % for the S&P 500 from 1920 to 2020. Its explanatory ability has varied over time in other markets, too.
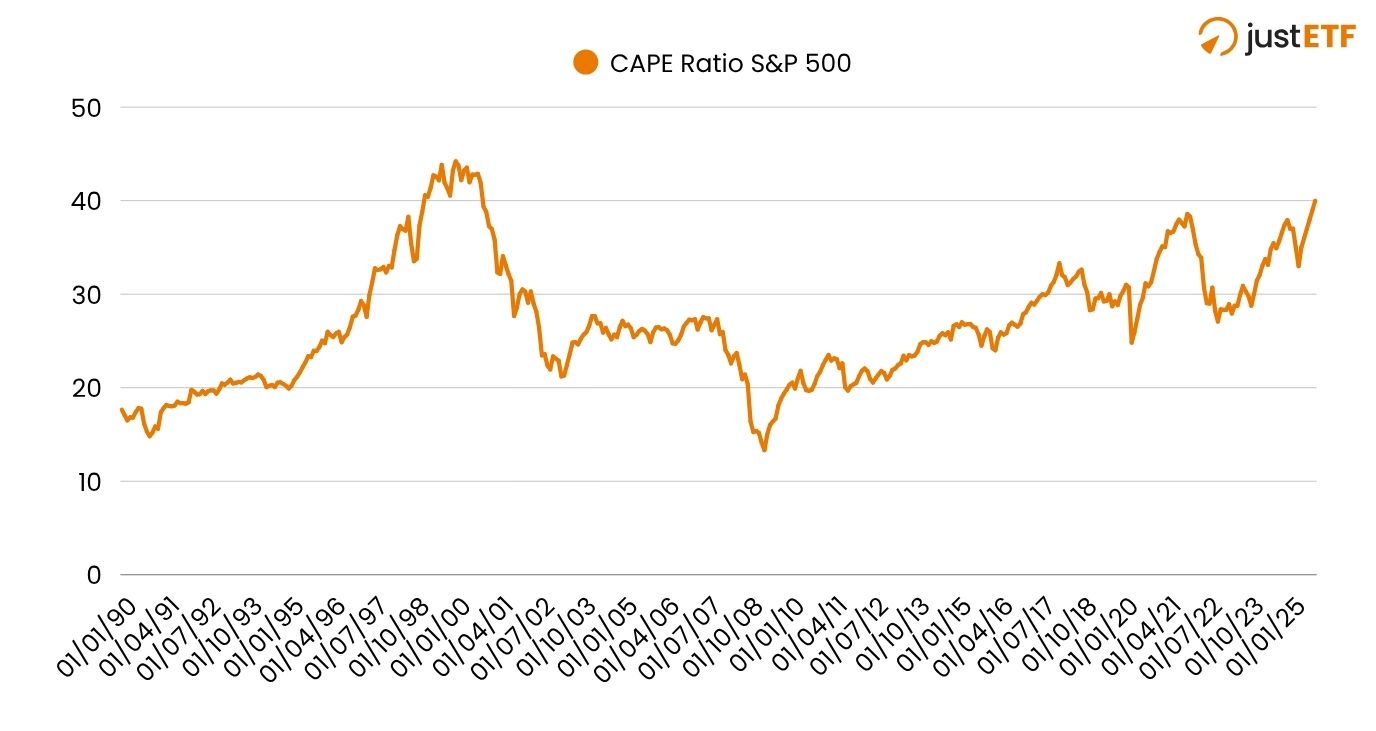
Performance of the CAPE-Ratio for the S&P 500 (1990-2025)
Source: justETF, own illustration based on Robert J. Shiller, 2000. Irrational Exuberance
The upshot is that markets often rise despite being “expensive” and fall even when “cheap”. Moreover, CAPE cannot tell you when the next correction will come.
CAPE fear
Recent S&P 500 returns are the most obvious illustration of the limitations of the CAPE ratio.
The S&P 500’s CAPE figure has remained above its historical average (or “fair value” level) for over 15 years. Indeed, some commentators were calling the US market “expensive” back in 2011.
Anyone paring back their US exposure back then would have missed out on exceptional returns in the years since.
But the US CAPE ratio has continued to climb. It’s now reached the 99th percentile. That is, the current S&P 500 CAPE score of 40 sits within the top 1 % of all its values going back to the 19th Century.
The only other time the S&P 500’s CAPE rose this high, the Dotcom bubble burst 16 months later.
Again, CAPE is a statistical observation, not a timing signal. It can’t predict imminent decline. But a deviation this far from the average is mostly associated with lower returns in the future.
Takeaway 1: Use valuations to set expectations, not time trades
Extreme CAPE signals tell us to lower our expectations about what a particular market is likely to achieve over the next decade.
It doesn't tell you to sell everything and wait for a crash. Market timing based on valuations fails consistently because "expensive" markets can become more expensive before falling back.
Takeaway 2: Valuations can inform diversification decisions
US stocks trading at premium valuations provide a rationale to trim exposure when the rest of the world (or other asset classes) look less expensive.
Naturally, any moves informed by valuations should reflect the degree of uncertainty involved.
For example, you may decide it's prudent to reduce your US allocation by up to 10% of its current weight in your portfolio.
Then, to reflect the probability that higher CAPE ratios correlate with worse outcomes, you could continue to tilt away from US stocks if valuations rise further.
For example, you could continue to reduce US stock market exposure by 2%, 5%, or even 10% for every one to two point rise in S&P 500 CAPE.
This is a very personal decision and there is no fact of the matter. The US market could continue to defy expectations. Or it could eventually revert to the mean.
Nobody can accurately predict the future, so resist the temptation to over-congratulate or criticise yourself if the market doesn’t play ball.
A good decision made for the right reasons can look wrong in retrospect if events don’t go your way. That’s bad luck, not bad decision-making.
And sometimes a call can look wrong before it comes right. This happened to many prominent figures during the Dotcom Boom.
Federal Reserve Chair Alan Greenspan famously questioned US market prices in December 1996. The S&P 500 went on to gain another 93 % before the market tanked.
Takeaway 3: Valuations offer awareness but not control
Remember that valuations offer probabilistic insights, not precise forecasts. All the same, understanding basic valuation concepts helps you stay realistic and set rational expectations for returns.
Savvy investors can use that knowledge to stay humble, avoid extremes, and focus on what they can control - time in the market, costs, and behaviour.
Valuations matter, but they shouldn’t be used to drive all or nothing decisions.
Stay up to date
Free English newsletter including the latest news & knowledge about investing in ETFs.