Votre sélection est vide.
Sélectionnez des ETF pour les comparer les uns aux autres.
Ajoutez un ETF à la sélection en le sélectionnant dans le sélecteur d’ETF ou sous « Comparer » sous le profil de l’ETF.
Trouver cet ETF chez un courtier
 Conseil Broker: Négocier cet ETF pour 0,99 € par ordre avec le Broker Scalable ou sans frais dans le cadre d'un plan d'épargne en ETF. En savoir plus
| Type de stratégie | Long-only |
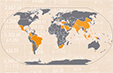
| Indice | MSCI Emerging Markets |
| Univers d’investissement | Actions, Marchés émergents |
| Taille du fonds | EUR 5 316 M |
| Frais totaux sur encours (TER) | 0,14% p.a. |
| Méthode de réplication | Synthétique (Swap non financé) |
| Structure juridique | ETF |
| Durabilité / ESG | Non |
| Devise du fonds | USD |
| Couverture de change | Non |
| Date de lancement / première cotation | 3 décembre 2020 |
| Distribution | Capitalisation |
| Domiciliation du fonds | Luxembourg |
| Émetteur | Amundi ETF |
| Éligible au PEA | Non |
| Allemagne | Inconnu |
| Suisse | ESTV Reporting |
| Autriche | Meldefonds |
| Grande-Bretagne | UK Reporting |
| Italie | 26,0% |
| Structure du fonds | Company With Variable Capital (SICAV) |
| Conforme à UCITS | Oui |
| Administrateur | SOCIETE GENERALE LUXEMBOURG |
| Conseiller en placement | |
| Banque dépositaire | SGSS - Paris |
| Auditeur | PWC |
| Fin de l’exercice | 31 décembre |
| Représentant suisse | Société Générale, Paris, Zweigniederlassung Zürich |
| Agent payeur suisse | Société Générale, Paris, Zweigniederlassung Zürich |
| Type d’indice | Indice de rendement total |
| Contrepartie au swap | Bank of America,Barclays,J.P. Morgan,Société Générale,BNP Paribas |
| Gestion des garantiesr | |
| Prêts de titres | Non |
| Contrepartie prêts de titres |
Retrouvez d’autres ETF dont l’objectif d’investissement est comparable à celui de Amundi Core MSCI Emerging Markets Swap UCITS ETF Acc.
| Taiwan Semiconductor Manufacturing Co., Ltd. | 15,57% |
| Samsung Electronics Co., Ltd. | 7,52% |
| SK hynix, Inc. | 5,82% |
| Tencent Holdings Ltd. | 2,80% |
| MediaTek, Inc. | 1,95% |
| Alibaba Group Holding Ltd. | 1,87% |
| Samsung Electronics Co., Ltd. | 0,99% |
| Delta Electronics, Inc. | 0,95% |
| China Construction Bank Corp. | 0,84% |
| Hon Hai Precision Industry Co., Ltd. | 0,79% |
| Technologie | 46,89% |
| Finance | 21,06% |
| Matériaux non énergétiques | 6,53% |
| Industrie | 5,59% |
| Autre | 19,93% |
| Courtier | Évaluation | Frais du plan d’épargne | Frais du courtier | |
|---|---|---|---|---|
 | 0,00 € | 0,00 € | Voir l'offre* | |
 | 0,00 € | 0,00 € | Voir l'offre** | |
 | 0,00 € | 0,00 € | Voir l'offre* |
| Année en cours | +19,03% |
| 1 mois | -5,78% |
| 3 mois | -4,50% |
| 6 mois | -2,84% |
| 1 an | +17,63% |
| 3 ans | +67,85% |
| 5 ans | - |
| Depuis le lancement (MAX) | +72,05% |
| 2025 | +18,37% |
| 2024 | +14,43% |
| 2023 | - |
| 2022 | - |
| Indicateur de risque |
Risque plus faible Risque plus élevé |
| Volatilité 1 an | 22,22% |
| Volatilité 3 ans | 17,28% |
| Volatilité 5 ans | - |
| Ratio rendement / risque sur 1 an | 0,79 |
| Ratio rendement / risque sur 3 ans | 1,09 |
| Ratio rendement / risque sur 5 ans | - |
| Perte maximale sur 1 an | -13,75% |
| Perte maximale sur 3 ans | -17,59% |
| Perte maximale sur 5 ans | - |
| Perte maximale depuis le lancement | -17,59% |
| Place de cotation | Devise de cotation | Ticker | Code Bloomberg / iNAV Bloomberg | Reuters RIC / iNAV Reuters | Teneur de marché |
|---|---|---|---|---|---|
| Borsa Italiana | EUR | LEMA | - - | - - | - |
| gettex | EUR | AE51 | - - | - - | - |
| Borsa Italiana | EUR | - | LEMA IM LEMAEUIV | LEMA.MI LEMAEURINAV=SOLA | Societe Generale Corporate and Investment Banking |
| London Stock Exchange | USD | LEMA | LEMA LN LEMAUSIV | LYLEMA.L LEMAUSDINAV=SOLA | Societe Generale Corporate and Investment Banking |
| XETRA | EUR | LEMA | LEMA GY LEMAEUIV | LEMA.DE LEMAEURINAV=SOLA | Societe Generale Corporate and Investment Banking |
| Nom du fonds | Taille du fonds en M € (AuM) | Frais annuels | Distribution | Réplication |
|---|---|---|---|---|
| Xtrackers MSCI Emerging Markets UCITS ETF 1C | 11 993 | 0,18% p.a. | Capitalisation | Échantillonnage |
| iShares MSCI EM UCITS ETF (Acc) | 9 216 | 0,18% p.a. | Capitalisation | Complète |
| iShares MSCI EM UCITS ETF (Dist) | 8 492 | 0,18% p.a. | Distribution | Complète |
| UBS Core MSCI EM UCITS ETF USD acc | 7 736 | 0,15% p.a. | Capitalisation | Échantillonnage |
| Amundi Core MSCI Emerging Markets Swap UCITS ETF Dist | 5 502 | 0,14% p.a. | Distribution | Synthétique |