Votre sélection est vide.
Sélectionnez des ETF pour les comparer les uns aux autres.
Ajoutez un ETF à la sélection en le sélectionnant dans le sélecteur d’ETF ou sous « Comparer » sous le profil de l’ETF.
Le MSCI Emerging Markets est un indice qui suit internationalement les actions de 24 pays émergents. Avec 1 178 composants (situation au 30/06/2026), cet indice libre couvre environ 85 % de la capitalisation boursière ajustée de chaque pays.
Les actions de Taïwan constituent le poids le plus important de l'indice MSCI Emerging Markets avec 27,34 %, suivies Corée du Sud (23,72 %) et chinoises (19,03 %). Les principaux secteurs de l'indice MSCI Emerging Markets sont ceux les technologies de l'information (45,26 %), des services financiers (18,40 %) et celui de la consommation discrétionnaire (7,23 %). Source : MSCI ; situation au : 30/06/2026
En investissant dans le secteur l’indice MSCI Emerging Markets par le biais d'ETF, vous profitez non seulement des hausses enregistrées par le cours des actions, mais aussi des dividendes des entreprises. Actuellement, vous pouvez choisir parmi 24 ETF pour un placement dans le secteur l’indice MSCI Emerging Markets.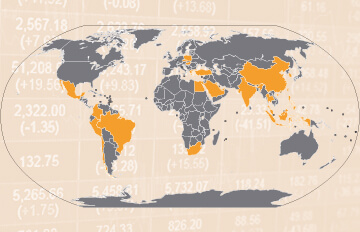
Source : justETF.com ; situation au : 01/08/2026 ; Calculs en EUR basés sur l'ETF le plus important.
Les frais totaux sur encours (TER) d’un ETF MSCI Emerging Markets varient entre 0,09% p.a. et 0,55% p.a.. Les ETF sont donc nettement plus avantageux que les fonds à gestion active. Calculez votre économie personnelle à l’aide de notre calculateur de coût des fonds.
| 1 | Amundi Core MSCI Emerging Markets Swap UCITS ETF Dist | 33,84% | ||
| 2 | UBS Core MSCI EM UCITS ETF USD dis | 33,75% | ||
| 3 | State Street SPDR MSCI Emerging Markets UCITS ETF USD | 33,70% |
Classement de tous les ETF MSCI Emerging Markets en fonction de leur rendement
| 1 | Xtrackers MSCI Emerging Markets UCITS ETF 1C | 10 905 M | ||
| 2 | iShares MSCI EM UCITS ETF (Dist) | 8 222 M | ||
| 3 | iShares MSCI EM UCITS ETF (Acc) | 8 056 M |
Classement de tous les ETF MSCI Emerging Markets en fonction du volume du fonds
| 1 | BNP Paribas Easy MSCI Emerging UCITS ETF Acc | 0,09% p.a. | ||
| 2 | BNP Paribas Easy MSCI Emerging UCITS ETF EUR Acc | 0,09% p.a. | ||
| 3 | Invesco MSCI Emerging Markets UCITS ETF | 0,09% p.a. |
Classement de tous les ETF MSCI Emerging Markets en fonction des frais totaux sur encours
Pour la sélection d’un l’indice MSCI Emerging Markets, outre les performances, d’autres facteurs jouent un rôle important lors de la décision. Pour faciliter la comparaison, vous trouverez une liste des ETF MSCI Emerging Markets avec les indications relatives à la taille, aux frais, à l’utilisation des revenus, au domicile du fonds et à la méthode de réplication classée en fonction de la taille des fonds.
Comparaison détaillée de tous les ETF MSCI Emerging Markets
Comparaison graphique de tous les ETF MSCI Emerging Markets
| ETF ISIN | Taille fonds en M EUR | Frais en % | Utilisation des revenus | Domicile du fonds | Méthode de réplication | |
|---|---|---|---|---|---|---|
| Xtrackers MSCI Emerging Markets UCITS ETF 1CIE00BTJRMP35 | 10 905 | 0,18% p.a. | Capitalisation | Irlande | Échantillonnage optimisé | |
| iShares MSCI EM UCITS ETF (Dist)IE00B0M63177 | 8 222 | 0,18% p.a. | Distribution | Irlande | Réplication complète | |
| iShares MSCI EM UCITS ETF (Acc)IE00B4L5YC18 | 8 056 | 0,18% p.a. | Capitalisation | Irlande | Réplication complète | |
| Amundi Core MSCI Emerging Markets Swap UCITS ETF DistLU2573966905 | 4 837 | 0,14% p.a. | Distribution | Luxembourg | Swap non financé | |
| Amundi Core MSCI Emerging Markets Swap UCITS ETF AccLU2573967036 | 4 722 | 0,14% p.a. | Capitalisation | Luxembourg | Swap non financé | |
| Amundi MSCI Emerging Markets Swap UCITS ETF EUR AccLU1681045370 | 3 872 | 0,20% p.a. | Capitalisation | Luxembourg | Swap non financé | |
| Amundi Core MSCI Emerging Markets UCITS ETF AccLU1437017350 | 3 865 | 0,18% p.a. | Capitalisation | Luxembourg | Réplication complète | |
| HSBC MSCI Emerging Markets UCITS ETF USDIE00B5SSQT16 | 3 413 | 0,15% p.a. | Distribution | Irlande | Réplication complète | |
| UBS Core MSCI EM UCITS ETF USD disLU0480132876 | 2 572 | 0,15% p.a. | Distribution | Luxembourg | Échantillonnage optimisé | |
| State Street SPDR MSCI Emerging Markets UCITS ETF USDIE00B469F816 | 1 735 | 0,18% p.a. | Capitalisation | Irlande | Réplication complète | |
| Amundi MSCI Emerging Markets Swap UCITS ETF USD AccLU1681045453 | 1 347 | 0,20% p.a. | Capitalisation | Luxembourg | Swap non financé | |
| HSBC MSCI Emerging Markets UCITS ETF USD (Acc)IE000KCS7J59 | 1 335 | 0,15% p.a. | Capitalisation | Irlande | Réplication complète | |
| Amundi Core MSCI Emerging Markets UCITS ETF EUR DistLU1737652583 | 1 040 | 0,18% p.a. | Distribution | Luxembourg | Réplication complète | |
| Amundi MSCI Emerging Markets Swap II UCITS ETF EUR AccFR0010429068 | 836 | 0,55% p.a. | Capitalisation | France | Swap non financé | |
| Xtrackers MSCI Emerging Markets Swap UCITS ETF 1CLU0292107645 | 812 | 0,49% p.a. | Capitalisation | Luxembourg | Swap non financé | |
| Xtrackers MSCI Emerging Markets UCITS ETF 1DIE000GWA2J58 | 722 | 0,18% p.a. | Distribution | Irlande | Réplication complète | |
| Invesco MSCI Emerging Markets UCITS ETF IE00B3DWVS88 | 371 | 0,09% p.a. | Capitalisation | Irlande | Swap non financé | |
| iShares MSCI EM Swap UCITS ETF USD (Acc)IE000S3N6R34 | 196 | 0,14% p.a. | Capitalisation | Irlande | Swap non financé | |
| Xtrackers MSCI Emerging Markets Swap UCITS ETF 1DLU2675291913 | 176 | 0,18% p.a. | Distribution | Luxembourg | Swap non financé | |
| UBS MSCI EM SF UCITS ETF USD accIE00B3Z3FS74 | 143 | 0,14% p.a. | Capitalisation | Irlande | Basée sur swap | |
| Amundi Core MSCI Emerging Markets UCITS ETF USD DistLU2277591868 | 86 | 0,18% p.a. | Distribution | Luxembourg | Réplication complète | |
| BNP Paribas Easy MSCI Emerging UCITS ETF AccLU3086273813 | 56 | 0,09% p.a. | Capitalisation | Luxembourg | Swap non financé | |
| Amundi MSCI Emerging Markets Swap II UCITS ETF USD AccFR0010435297 | 44 | 0,55% p.a. | Capitalisation | France | Swap non financé | |
| BNP Paribas Easy MSCI Emerging UCITS ETF EUR AccLU3257630437 | 2 | 0,09% p.a. | Capitalisation | Luxembourg | Swap non financé |
Source : justETF.com ; situation au : 01/08/2026
Le tableau suivant compare les performances de tous les l’indice MSCI Emerging Markets. Toutes les indications relatives aux performances sont données à la fin du mois et comprennent les distributions. Outre les performances à une date de référence, l’évolution dans le temps est décisive pour la comparaison des ETFs. Pour cela, servez-vous aussi de nos comparaisons graphiques.
Source : justETF.com ; situation au : 31/07/2026 ; indications en EUR, distributions comprises