Your selection basket is empty.
Define a selection of ETFs which you would like to compare.
Add an ETF by clicking "Compare" on an ETF profile or by checkmarking an ETF in the ETF search.
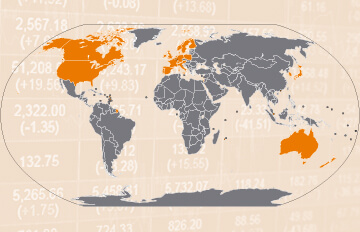
The FTSE Developed index is an international equity index, which tracks stocks from developed markets worldwide. As such, it represents FTSE's counterpart to the MSCI World index. With its 1,975 (As of 30/06/2026) constituents, the FTSE Developed index covers most of the investable market capitalisation in developed markets.
ETF investors can benefit from price gains and dividends of the FTSE Developed constituents. Currently, the FTSE Developed index is tracked by 3 ETFs.
Source: justETF.com; As of 30/07/2026; Performance in GBP, based on the largest ETF.
The total expense ratio (TER) of FTSE Developed ETFs is between 0.09% p.a. and 0.12% p.a.. In comparison, most actively managed funds do cost much more fees per year. Calculate your individual cost savings by using our cost calculator.
| 1 | Vanguard FTSE Developed World UCITS ETF Distributing | 28.31% | ||
| 2 | Vanguard FTSE Developed World UCITS ETF Acc | 28.30% | ||
| 3 | Franklin FTSE Developed World UCITS ETF USD Capitalisation | 28.27% |
All FTSE Developed ETFs ranked by fund return
| 1 | Vanguard FTSE Developed World UCITS ETF Acc | 4,827 m | ||
| 2 | Vanguard FTSE Developed World UCITS ETF Distributing | 3,446 m | ||
| 3 | Franklin FTSE Developed World UCITS ETF USD Capitalisation | 16 m |
All FTSE Developed ETFs ranked by fund size
| 1 | Franklin FTSE Developed World UCITS ETF USD Capitalisation | 0.09% p.a. | ||
| 2 | Vanguard FTSE Developed World UCITS ETF Acc | 0.12% p.a. | ||
| 3 | Vanguard FTSE Developed World UCITS ETF Distributing | 0.12% p.a. |
All FTSE Developed ETFs ranked by total expense ratio
Besides return, there are further important factors to consider when selecting a FTSE Developed ETF. In order to provide a sound decision basis, you find a list of all FTSE Developed ETFs with details on size, cost, age, use of profits, fund domicile and replication method ranked by fund size.
Compare all FTSE Developed ETFs in detail
Compare all FTSE Developed ETFs in a chart
| Provider ISIN | Fund size in m GBP | TER in % | Use of profits | Fund domicile | Replication method | |
|---|---|---|---|---|---|---|
| Vanguard FTSE Developed World UCITS ETF AccIE00BK5BQV03 | 4,827 | 0.12% p.a. | Accumulating | Ireland | Optimized sampling | |
| Vanguard FTSE Developed World UCITS ETF DistributingIE00BKX55T58 | 3,446 | 0.12% p.a. | Distributing | Ireland | Optimized sampling | |
| Franklin FTSE Developed World UCITS ETF USD CapitalisationIE000CVOSY02 | 16 | 0.09% p.a. | Accumulating | Ireland | Full replication |
Source: justETF.com; As of 30/07/2026
The table shows the returns of all FTSE Developed ETFs in comparison. All return figures are including dividends as of month end. Besides the return the reference date on which you conduct the comparison is important. In order to find the best ETFs, you can also perform a chart comparison.
| ETF | 1 month in % | 3 months in % | 6 months in % | 1 year in % | 3 years in % | |
|---|---|---|---|---|---|---|
| Vanguard FTSE Developed World UCITS ETF Distributing | 0.78% | 17.59% | 13.09% | 28.31% | 65.74% | |
| Vanguard FTSE Developed World UCITS ETF Acc | 0.78% | 17.59% | 13.08% | 28.30% | 65.75% | |
| Franklin FTSE Developed World UCITS ETF USD Capitalisation | 0.81% | 17.56% | 13.06% | 28.27% | - |
| ETF | 2026 in % | 2025 in % | 2024 in % | 2023 in % | 2022 in % | |
|---|---|---|---|---|---|---|
| Vanguard FTSE Developed World UCITS ETF Distributing | 12.88% | 13.87% | 19.61% | 17.13% | -8.15% | |
| Vanguard FTSE Developed World UCITS ETF Acc | 12.86% | 13.88% | 19.59% | 17.14% | -8.16% | |
| Franklin FTSE Developed World UCITS ETF USD Capitalisation | 12.68% | 13.78% | - | - | - |
Source: justETF.com; As of 30/06/2026; Calculations in GBP including dividends

