De beste brokers vergeleken 10/2026
Door ons onderzocht en overzichtelijk voor je samengevat.

thyssenkrupp AG

ISIN DE0007500001

 | 

WKN 750000

Marktkapitalisatie (in EUR)
8.323 m
Land
Alemania
Sector
Industrial
Dividendrendement
1,12%
Advertisement
Je kapitaal loopt risico. Meer informatie en voorwaarden op trading212.com
 

Overzicht

Koers

Handel met je broker

Kies uw broker
Advertisement
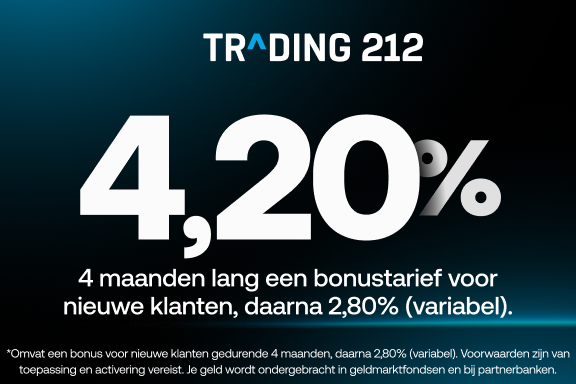
Trading212Beleg met Trading 212: 4,20 % rente op euro's en beleg in 12.000+ aandelen & ETF's. Account openen*
Je kapitaal loopt risico. Meer informatie en voorwaarden op trading212.com

Beschrijving

thyssenkrupp AG es una empresa industrial y tecnológica internacional que se dedica al desarrollo y la producción de soluciones basadas en la tecnología para satisfacer las necesidades de los clientes y del mercado. Opera a través de los siguientes segmentos: Automotive Technology, Decarbon Technologies, Material Services, Steel Europe y Marine Systems. El segmento Automotive Technology suministra componentes y sistemas para la industria del automóvil. El segmento Decarbon Technologies incluye componentes utilizados en turbinas solares y eólicas, participaciones en el negocio de la electrólisis del hidrógeno, tecnologías para el craqueo del amoníaco y la utilización de productos químicos ecológicos, así como tecnologías para la transformación ecológica de la industria cementera. El segmento de Servicios de Materiales distribuye una cartera que abarca desde materiales y materias primas hasta servicios técnicos y procesos en Europa y Norteamérica. El segmento Steel Europe participa en las actividades de acero plano al carbono, como soluciones de materiales y piezas acabadas. El segmento Marine System fabrica submarinos convencionales, buques de guerra y electrónica marina. La empresa se fundó el 17 de marzo de 1999 y tiene su sede en Essen (Alemania).
Toon meer Toon minder
Industrial Servicios Industriales Distribución industrial diversificada Alemania

Grafiek

Financiële kerngegevens

Kerncijfers

Marktkapitalisatie, EUR 8.323 m
WPA, EUR 0,46
KBV 0,9
K/W 29,0
Dividendrendement 1,12%

Winst- en verliesrekening (2025)

Omzet, EUR 32.837 m
Netto-inkomen, EUR 465 m
Winstmarge 1,42%
Advertisement
Trading212
Beleg met Trading212
4,20 % rente op euro's en beleg in 12.000+ aandelen & ETF's.
Account openen
Je kapitaal loopt risico. Meer informatie en voorwaarden op trading212.com

In welke ETF zit thyssenkrupp AG?

Er zijn 69 ETF's die thyssenkrupp AG bevatten. Al deze ETF's staan in de tabel hieronder. De ETF met de grootste weging van thyssenkrupp AG is de First Trust Germany AlphaDEX UCITS ETF Dist.
ETF Weging Investeringsfocus Fondsgrootte (in m EUR)
Amundi MSCI World Small Cap ESG Broad Transition UCITS ETF Acc 0,02%
Aandelen
Wereld
Small Cap
Klimaatverandering
487
iShares STOXX Europe 600 UCITS ETF (DE) EUR (Acc) 0,05%
Aandelen
Europa
960
iShares EURO STOXX Mid UCITS ETF 0,88%
Aandelen
Europa
Mid Cap
542
Vanguard FTSE Global Small-Cap UCITS ETF USD Acc 0,07%
Aandelen
Wereld
Small Cap
36
Invesco RAFI All-World Fundamental Value UCITS ETF 0,04%
Aandelen
Wereld
Waarde
418
Amundi Core Stoxx Europe 600 UCITS ETF Dist 0,05%
Aandelen
Europa
2
iShares STOXX Europe 600 UCITS ETF (DE) 0,05%
Aandelen
Europa
9.573
First Trust Germany AlphaDEX UCITS ETF Dist 4,61%
Aandelen
Duitsland
Multi-factorstrategie
7
Amundi F.A.Z. 100 UCITS ETF Dist 0,32%
Aandelen
Duitsland
102
iShares MDAX® UCITS ETF (DE) EUR (Dist) 4,40%
Aandelen
Duitsland
Mid Cap
31
L&G Gerd Kommer Multifactor Equity UCITS ETF USD Distributing 0,02%
Aandelen
Wereld
Multi-factorstrategie
247
iShares MSCI EMU Small Cap UCITS ETF (Acc) 1,28%
Aandelen
Europa
Small Cap
822
Amundi MSCI Europe Small Cap ESG Broad Transition UCITS ETF Acc 0,12%
Aandelen
Europa
Small Cap
Klimaatverandering
105
Xtrackers STOXX Europe 600 UCITS ETF 1C 0,05%
Aandelen
Europa
4.254
State Street SPDR MSCI World Small Cap UCITS ETF USD Unhedged (Dist) 0,08%
Aandelen
Wereld
Small Cap
46
Vanguard FTSE Global All-Cap UCITS ETF USD Acc 0,01%
Aandelen
Wereld
3.374
Invesco RAFI Europe Fundamental Value UCITS ETF Dist 0,17%
Aandelen
Europa
Waarde
34
Xtrackers Stoxx Europe 600 II UCITS ETF 1C 0,05%
Aandelen
Europa
8
Invesco MDAX UCITS ETF 4,24%
Aandelen
Duitsland
Mid Cap
692
State Street SPDR MSCI All Country World Investable Market UCITS ETF USD Unhedged (Acc) 0,01%
Aandelen
Wereld
8.371
State Street Europe Small Cap Screened Equity Fund UCITS ETF 0,14%
Aandelen
Europa
Small Cap
4
iShares STOXX Europe 600 UCITS ETF EUR (Acc) 0,05%
Aandelen
Europa
3
UBS MSCI EMU Small Cap UCITS ETF EUR Ukdis 1,32%
Aandelen
Europa
Small Cap
16
State Street SPDR MSCI All Country World Investable Market UCITS ETF USD Unhedged (Dist) 0,01%
Aandelen
Wereld
244
Vanguard FTSE Global All-Cap UCITS ETF USD Dist 0,01%
Aandelen
Wereld
115
Xtrackers MSCI World Small Cap UCITS ETF 1C 0,04%
Aandelen
Wereld
Small Cap
140
Amundi Core Stoxx Europe 600 UCITS ETF USD Hedged Acc 0,05%
Aandelen
Europa
136
iShares Europe Domestic Focus UCITS ETF EUR (Acc) 0,15%
Aandelen
Europa
10
Amundi Core Stoxx Europe 600 UCITS ETF Acc 0,05%
Aandelen
Europa
21.708
Vanguard Germany All Cap UCITS ETF (EUR) Distributing 0,38%
Aandelen
Duitsland
251
L&G Gerd Kommer Multifactor Equity UCITS ETF USD Accumulating 0,02%
Aandelen
Wereld
Multi-factorstrategie
1.488
Amundi STOXX Europe 600 ESG UCITS ETF DR EUR (C) 0,06%
Aandelen
Europa
Sociaal/Milieu
1.765
Xtrackers Electrification Technologies & Smart Grid UCITS ETF 1C 0,47%
Aandelen
Wereld
Infrastructuur
Elektrificatie
136
Xtrackers Stoxx Europe 600 UCITS ETF 2C - EUR Hedged 0,05%
Aandelen
Europa
18
iShares MDAX UCITS ETF (DE) 4,40%
Aandelen
Duitsland
Mid Cap
1.348
State Street SPDR MSCI Europe Small Cap Value Weighted UCITS ETF EUR 1,19%
Aandelen
Europa
Small Cap
773
Amundi MSCI Europe Small Cap ESG Broad Transition UCITS ETF Dist 0,12%
Aandelen
Europa
Small Cap
Klimaatverandering
209
Vanguard FTSE Developed Europe Small-Cap UCITS ETF EUR Dist 0,65%
Aandelen
Europa
Small Cap
1
Amundi MDAX UCITS ETF Dist 4,23%
Aandelen
Duitsland
Mid Cap
170
UBS MSCI EMU Select Factor Mix UCITS ETF EUR acc 0,21%
Aandelen
Europa
Multi-factorstrategie
16
iShares STOXX Europe 600 UCITS ETF EUR (Dist) 0,05%
Aandelen
Europa
10
Franklin STOXX Europe 600 Paris Aligned Climate UCITS ETF 0,01%
Aandelen
Europa
Sociaal/Milieu
Klimaatverandering
34
First Trust Eurozone AlphaDEX UCITS ETF B Dist 1,57%
Aandelen
Europa
Multi-factorstrategie
18
UBS MSCI EMU Small Cap UCITS ETF EUR acc 1,32%
Aandelen
Europa
Small Cap
272
Amundi Euro Stoxx UCITS ETF Dist 0,10%
Aandelen
Europa
57
Vanguard FTSE Developed Europe Small-Cap UCITS ETF EUR Acc 0,65%
Aandelen
Europa
Small Cap
73
Xtrackers Euro Stoxx UCITS ETF 1C 0,10%
Aandelen
Europa
1
Xtrackers Stoxx Europe 600 UCITS ETF 1D 0,05%
Aandelen
Europa
1.507
State Street SPDR MSCI Europe Small Cap UCITS ETF EUR 0,53%
Aandelen
Europa
Small Cap
287
iShares MSCI World Small Cap UCITS ETF 0,08%
Aandelen
Wereld
Small Cap
7.973
Vanguard FTSE Global Small-Cap UCITS ETF USD Dist 0,07%
Aandelen
Wereld
Small Cap
11
Amundi MDAX UCITS ETF Acc 4,23%
Aandelen
Duitsland
Mid Cap
3
Invesco STOXX Europe 600 UCITS ETF 0,05%
Aandelen
Europa
519
Xtrackers MSCI Europe Small Cap UCITS ETF 1C 0,51%
Aandelen
Europa
Small Cap
3.331
WisdomTree Europe SmallCap Dividend UCITS ETF 0,00%
Aandelen
Europa
Small Cap
51
State Street SPDR MSCI World Small Cap UCITS ETF USD Unhedged (Acc) 0,08%
Aandelen
Wereld
Small Cap
1.502
UBS MSCI EMU Small Cap UCITS ETF EUR dis 1,32%
Aandelen
Europa
Small Cap
353
iShares STOXX Europe 600 Industrial Goods & Services UCITS ETF (DE) 0,34%
Aandelen
Europa
Industrie
547
Amundi Core Stoxx Europe 600 UCITS ETF EUR Hedged Dist 0,05%
Aandelen
Europa
57
Xtrackers Euro Stoxx UCITS ETF 1D 0,10%
Aandelen
Europa
55
Xtrackers Stoxx Europe 600 II UCITS ETF 1D 0,05%
Aandelen
Europa
5
Invesco Europe Enhanced Equity UCITS ETF Acc 0,09%
Aandelen
Europa
Multi-factorstrategie
304
First Trust Eurozone AlphaDEX UCITS ETF Acc 1,57%
Aandelen
Europa
Multi-factorstrategie
104
iShares MSCI World Small Cap CTB Enhanced ESG UCITS ETF USD (Acc) 0,02%
Aandelen
Wereld
Small Cap
426
Xtrackers MSCI World IMI UCITS ETF 1C Capitalisation 0,01%
Aandelen
Wereld
24
WisdomTree Europe SmallCap Dividend UCITS ETF Acc 0,00%
Aandelen
Europa
Small Cap
36
iShares MSCI Europe Small Cap UCITS ETF EUR (Acc) 0,51%
Aandelen
Europa
Small Cap
9
Amundi MSCI EMU Small Cap ESG Broad Transition UCITS ETF Dist 0,33%
Aandelen
Europa
Small Cap
Klimaatverandering
570
UBS MSCI World Small Cap UCITS ETF USD acc 0,08%
Aandelen
Wereld
Small Cap
41

Beleggingsplanaanbiedingen

Hier vind je informatie over de beschikbaarheid van het beleggingsplan voor dit aandeel. Je kunt de tabel gebruiken om beleggingsplanaanbiedingen voor de geselecteerde investeringsbedrag te vergelijken.
 
Broker Rating Kosten beleggingsplan Kosten brokeraccount
0,00 €
0,00 €
Bekijk aanbod**
0,00 €
0,00 €
Bekijk aanbod*
0,00 €
0,00 €
Bekijk aanbod*
0,00 €
0,00 €
Bekijk aanbod*
Gedetailleerde vergelijking van alle aanbiedingen
Bron: justETF Research; Vanaf 10/2026. De aanbiedingen zijn als volgt gesorteerd: 1. Rating 2. Kosten beleggingsplan 3. Aantal aandelenspaarplannen. Het aantal aandelenspaarplannen is afgerond. Er kan geen garantie worden gegeven voor de volledigheid en juistheid van de vermelde informatie. De informatie van de online brokers is doorslaggevend. Naast de aangegeven makelaarskosten kunnen extra kosten (bijv. spreads, fooien en productkosten) van toepassing zijn.
*Affiliate link
** Belangrijke opmerking: Sinds 2021 maken wij deel uit van de Scalable-groep en zijn wij een 100% dochteronderneming van Scalable AG. Hierdoor zijn wij economisch verbonden, maar redactioneel onafhankelijk. Belangenconflicten worden vermeden, omdat brokers – inclusief Scalable – worden beoordeeld volgens uniforme, objectieve criteria. Want uiteindelijk moet jij zelf beslissen hoe en bij wie je wilt beleggen.

Prestaties

Rendementsoverzicht

YTD +45,71%
1 maand -9,65%
3 maanden +13,83%
6 maanden +53,10%
1 jaar +51,22%
3 jaar +111,53%
5 jaar +56,63%
Since inception -39,40%
2025 +137,76%
2024 -38,07%
2023 +11,05%
2022 -40,75%

Maandelijks rendement in een heat map

Risico

Risk metrics in this section:
 
  • Volatility, annualised, measured for 1, 3 and 5 year periods. The annualised volatility reflects the degree of price fluctuations during a one year period. The higher the volatility, the more significantly the price of the asset (stock, ETF, etc.) has changed in the past. Assets with higher volatility are generally considered more risky. We calculate the volatility based on the data for the past 1, 3 and 5 years so that you can see if price fluctuations for the ETF became stronger or weaker over time.
  • Return per risk for 1, 3 and 5 year periods. This is the annualised (i.e. converted to a one year period) past return divided by the past annualised volatility. The metric puts the historical return of an asset in relation to its historical risk and gives you a retrospective indication of the degree of price fluctuation you had to bear with in order to obtain the return. We calculate this parameter for 1, 3 and 5 year periods to display its evolution over time.
  • Maximum drawdown for a period. This shows the worst possible loss an investor could have suffered during the respective period, by first buying and subsequently selling the asset at the least favourable prices. For example, if there was the following sequence of daily ETF prices: 10€, 5€, 12€, 20€, an investor would have suffered the worst loss by buying for 10€ and subsequently selling for 5€. Therefore in this case the maximum drawdown would be (5€ - 10€)/10€ = -50%.
ETF-rendementen zijn inclusief dividenduitkeringen (indien van toepassing).
Toon meer Toon minder

Risico-overzicht

Volatiliteit 1 jaar 50,97%
Volatiliteit 3 jaar 54,24%
Volatiliteit 5 jaar 51,56%
Rendement/Risico 1 jaar 1,01
Rendement/Risico 3 jaar 0,52
Rendement/Risico 5 jaar 0,18
Maximaal waardedaling 1 jaar -41,90%
Maximaal waardedaling 3 jaar -60,81%
Maximaal waardedaling 5 jaar -74,36%
Maximaal waardedaling sinds aanvang -89,57%

Voortschrijdende volatiliteit over 1 jaar

— Gegevens verstrekt door Trackinsight, etfinfo, Xignite Inc., gettex, FactSet en justETF GmbH.

Standaard zijn ETF-rendementen inclusief dividenduitkeringen (indien van toepassing). Er is geen garantie voor de volledigheid, juistheid en correctheid van de getoonde informatie.