Deine Auswahl ist leer.
Triff eine Auswahl an ETFs, um diese miteinander zu vergleichen.
Füge einen ETF durch Auswählen in der ETF-Suche oder „Vergleichen“ auf dem ETF-Profil zur Auswahl hinzu.
Der MSCI World-Index ist ein internationaler Aktienindex, der die Wertentwicklung von Unternehmen aus 23 Industrieländern abbildet. Mit 1.283 Unternehmen weltweit (Stand: 30.06.2026) spiegelt der MSCI World-Index ungefähr 85 Prozent der weltweiten Marktkapitalisierung in Industrieländern wider.
Mit 72,45 Prozent sind Unternehmen aus den USA am stärksten im MSCI World-Index vertreten. Danach folgen Japan (5,69%) und Grossbritannien (3,45%). Zu den am stärksten vertretenen Sektoren im MSCI World-Index zählen Informationstechnologie (30,27%), Finanzdienstleistungen (15,88%) und Industriewerte (11,64%). Die zehn grössten Unternehmen im MSCI World machen 25,74% des Index aus. Quelle: MSCI; Stand: 30.06.2026
Mit einem Investment in den MSCI World-Index über ETFs partizipierst du neben Kursgewinnen an den Dividenden der Unternehmen. Aktuell stehen dir 18 ETFs für eine Anlage in den MSCI World zur Verfügung. Die börsengehandelten Indexfonds gibt es dabei oftmals sowohl als ausschüttende als auch als thesaurierende ETFs.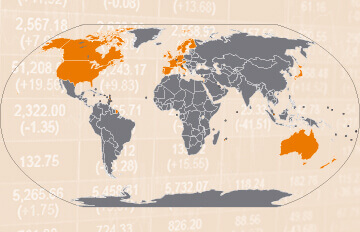
Quelle: justETF.com; Stand: 20.07.26; Wertentwicklung in CHF, basierend auf dem grössten ETF.
Die Gesamtkostenquote – auch Total Expense Ratio (TER) genannt – eines MSCI World-ETFs liegt zwischen 0,05% p.a. und 0,50% p.a.. Damit sind ETFs deutlich günstiger als aktiv verwaltete Fonds. Berechnen Sie Ihre persönliche Kostenersparnis mit unserem Fonds-Kostenrechner.
| 1 | iShares MSCI World Swap UCITS ETF USD (Acc) | 23,41% | ||
| 2 | UBS Core MSCI World UCITS ETF USD acc | 23,41% | ||
| 3 | UBS Core MSCI World UCITS ETF USD dis | 23,38% |
Alle MSCI World-ETFs nach Fondsrendite sortiert
| 1 | iShares Core MSCI World UCITS ETF USD (Acc) | 114.412 Mio. | ||
| 2 | Xtrackers MSCI World UCITS ETF 1C | 18.343 Mio. | ||
| 3 | State Street SPDR MSCI World UCITS ETF USD Unhedged | 15.918 Mio. |
Alle MSCI World-ETFs nach Fondsvolumen sortiert
| 1 | BNP Paribas Easy MSCI World UCITS ETF USD Acc | 0,05% p.a. | ||
| 2 | Invesco MSCI World UCITS ETF | 0,05% p.a. | ||
| 3 | UBS Core MSCI World UCITS ETF USD acc | 0,06% p.a. |
Alle MSCI World-ETFs nach Gesamtkostenquote sortiert
Für die Auswahl eines MSCI World-ETF sind neben der Wertentwicklung weitere Faktoren für die Entscheidungsfindung wichtig. Zum besseren Vergleich finden Sie eine Liste aller MSCI World-ETFs mit Angaben zu Grösse, Kosten, Ertragsverwendung, Fondsdomizil und Replikationsmethode sortiert nach Fondsgrösse.
Alle MSCI World-ETFs im Detail vergleichen
Alle MSCI World-ETFs im Chart-Vergleich
| ETF ISIN | Fondsgrösse in Mio. CHF | TER in % | Ertrags- verwendung | Fonds- domizil | Replikations- methode | |
|---|---|---|---|---|---|---|
| iShares Core MSCI World UCITS ETF USD (Acc)IE00B4L5Y983 | 114.412 | 0,20% p.a. | Thesaurierend | Irland | Optimiertes Sampling | |
| Xtrackers MSCI World UCITS ETF 1CIE00BJ0KDQ92 | 18.343 | 0,12% p.a. | Thesaurierend | Irland | Optimiertes Sampling | |
| State Street SPDR MSCI World UCITS ETF USD UnhedgedIE00BFY0GT14 | 15.918 | 0,12% p.a. | Thesaurierend | Irland | Optimiertes Sampling | |
| Amundi Core MSCI World UCITS ETF AccIE000BI8OT95 | 13.194 | 0,12% p.a. | Thesaurierend | Irland | Vollständige Replikation | |
| HSBC MSCI World UCITS ETF USDIE00B4X9L533 | 12.627 | 0,15% p.a. | Ausschüttend | Irland | Optimiertes Sampling | |
| UBS Core MSCI World UCITS ETF USD accIE00BD4TXV59 | 9.178 | 0,06% p.a. | Thesaurierend | Irland | Vollständige Replikation | |
| Amundi MSCI World Swap II UCITS ETF FR0010315770 | 8.048 | 0,30% p.a. | Ausschüttend | Frankreich | Unfunded Swap | |
| iShares MSCI World UCITS ETF (Dist)IE00B0M62Q58 | 7.465 | 0,50% p.a. | Ausschüttend | Irland | Optimiertes Sampling | |
| Invesco MSCI World UCITS ETF IE00B60SX394 | 7.267 | 0,05% p.a. | Thesaurierend | Irland | Unfunded Swap | |
| Amundi MSCI World Swap UCITS ETF EUR AccLU1681043599 | 5.922 | 0,38% p.a. | Thesaurierend | Luxemburg | Unfunded Swap | |
| Xtrackers MSCI World Swap UCITS ETF 1CLU0274208692 | 4.849 | 0,45% p.a. | Thesaurierend | Luxemburg | Unfunded Swap | |
| Xtrackers MSCI World UCITS ETF 1DIE00BK1PV551 | 4.434 | 0,12% p.a. | Ausschüttend | Irland | Optimiertes Sampling | |
| UBS Core MSCI World UCITS ETF USD disIE00B7KQ7B66 | 1.799 | 0,06% p.a. | Ausschüttend | Irland | Vollständige Replikation | |
| HSBC MSCI World UCITS ETF USD (Acc)IE000UQND7H4 | 1.782 | 0,15% p.a. | Thesaurierend | Irland | Optimiertes Sampling | |
| iShares MSCI World Swap UCITS ETF USD (Acc)IE000F9IDGB5 | 1.651 | 0,12% p.a. | Thesaurierend | Irland | Unfunded Swap | |
| UBS MSCI World UCITS ETF USD disLU0340285161 | 1.353 | 0,30% p.a. | Ausschüttend | Luxemburg | Vollständige Replikation | |
| BNP Paribas Easy MSCI World UCITS ETF USD AccIE000Y2ZYZ66 | 74 | 0,05% p.a. | Thesaurierend | Irland | Optimiertes Sampling | |
| Amundi MSCI World Swap UCITS ETF USD AccLU1681043672 | 68 | 0,38% p.a. | Thesaurierend | Luxemburg | Unfunded Swap |
Quelle: justETF.com; Stand: 20.07.26
Die folgende Tabelle zeigt Ihnen die Wertentwicklung aller ETFs auf den MSCI World im Vergleich. Alle Angaben zur Wertentwicklung sind per Monatsende und inklusive Ausschüttungen. Neben der Wertentwicklung zu einem Stichtag ist für den Vergleich von ETFs die Wertentwicklung im Zeitverlauf entscheidend. Nutzen Sie hierfür auch unseren Chartvergleich.
| ETF | 1 Monat in % | 3 Monate in % | 6 Monate in % | 1 Jahr in % | 3 Jahre in % | |
|---|---|---|---|---|---|---|
| iShares MSCI World Swap UCITS ETF USD (Acc) | 2,56% | 17,61% | 11,71% | 23,41% | - | |
| UBS Core MSCI World UCITS ETF USD acc | 2,74% | 17,84% | 11,74% | 23,41% | 52,99% | |
| UBS Core MSCI World UCITS ETF USD dis | 2,73% | 17,81% | 11,75% | 23,38% | 52,98% | |
| State Street SPDR MSCI World UCITS ETF USD Unhedged | 2,69% | 17,72% | 11,67% | 23,28% | 53,02% | |
| Invesco MSCI World UCITS ETF | 2,74% | 17,80% | 11,73% | 23,26% | 52,74% | |
| HSBC MSCI World UCITS ETF USD | 2,75% | 17,77% | 11,68% | 23,24% | 52,64% | |
| Amundi Core MSCI World UCITS ETF Acc | 2,73% | 17,82% | 11,71% | 23,23% | - | |
| HSBC MSCI World UCITS ETF USD (Acc) | 2,73% | 17,77% | 11,65% | 23,23% | 52,65% | |
| Xtrackers MSCI World UCITS ETF 1C | 2,71% | 17,79% | 11,70% | 23,23% | 52,58% | |
| Xtrackers MSCI World UCITS ETF 1D | 2,72% | 17,78% | 11,70% | 23,23% | 52,80% | |
| iShares Core MSCI World UCITS ETF USD (Acc) | 2,71% | 17,71% | 11,65% | 23,20% | 52,50% | |
| Xtrackers MSCI World Swap UCITS ETF 1C | 2,71% | 17,74% | 11,63% | 23,04% | 52,12% | |
| Amundi MSCI World Swap II UCITS ETF | 2,59% | 17,19% | 11,32% | 22,94% | 52,72% | |
| UBS MSCI World UCITS ETF USD dis | 2,71% | 17,73% | 11,59% | 22,90% | 51,46% | |
| iShares MSCI World UCITS ETF (Dist) | 2,69% | 17,64% | 11,48% | 22,76% | 51,20% | |
| Amundi MSCI World Swap UCITS ETF USD Acc | 2,69% | 17,68% | 11,50% | 22,73% | 51,25% | |
| Amundi MSCI World Swap UCITS ETF EUR Acc | 2,56% | 17,08% | 11,13% | 22,51% | 51,35% | |
| BNP Paribas Easy MSCI World UCITS ETF USD Acc | 2,68% | 17,80% | 11,79% | - | - |
Quelle: justETF.com; Stand: 30.06.26; Angaben in CHF inklusive Ausschüttungen

