Deine Auswahl ist leer.
Triff eine Auswahl an ETFs, um diese miteinander zu vergleichen.
Füge einen ETF durch Auswählen in der ETF-Suche oder „Vergleichen“ auf dem ETF-Profil zur Auswahl hinzu.
Der MSCI Europe-Index ist ein Aktienindex, der die Wertentwicklung von Unternehmen aus europäischen Industrieländern abbildet. Mit 397 Unternehmen (Stand: 30.06.26) spiegelt der MSCI Europe-Index ungefähr 85 Prozent der Marktkapitalisierung der europäischen Industrieländer wider.
Mit einem Investment in den MSCI Europe-Index über ETFs partizipierst du neben Kursgewinnen an den Dividenden der Unternehmen. Aktuell stehen dir 17 ETFs für eine Anlage in den MSCI Europe zur Verfügung. Die börsengehandelten Indexfonds gibt es dabei oftmals sowohl als ausschüttende als auch als thesaurierende ETFs.
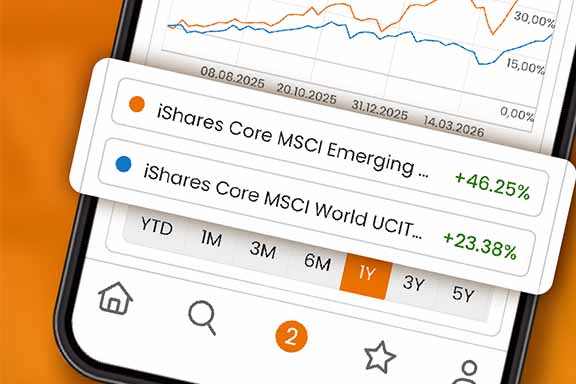
Quelle: justETF.com; Stand: 31.07.26; Wertentwicklung in EUR, basierend auf dem größten ETF.
Die Gesamtkostenquote – auch Total Expense Ratio (TER) genannt – eines MSCI Europe-ETFs liegt zwischen 0,06% p.a. und 0,30% p.a.. Damit sind ETFs deutlich günstiger als aktiv verwaltete Fonds. Berechne deine persönliche Kostenersparnis mit unserem Fonds-Kostenrechner.
| 1 | Xtrackers MSCI Europe UCITS ETF 1C | 22,33% | ||
| 2 | Xtrackers MSCI Europe UCITS ETF 1D | 22,32% | ||
| 3 | UBS Core MSCI Europe UCITS ETF EUR dis | 22,22% |
Alle MSCI Europe-ETFs nach Fondsrendite sortiert
| 1 | iShares Core MSCI Europe UCITS ETF EUR (Acc) | 15.780 Mio. | ||
| 2 | iShares Core MSCI Europe UCITS ETF EUR (Dist) | 10.636 Mio. | ||
| 3 | Xtrackers MSCI Europe UCITS ETF 1C | 7.670 Mio. |
Alle MSCI Europe-ETFs nach Fondsvolumen sortiert
| 1 | BNP Paribas Easy MSCI Europe UCITS ETF Acc | 0,06% p.a. | ||
| 2 | UBS Core MSCI Europe UCITS ETF EUR acc | 0,06% p.a. | ||
| 3 | UBS Core MSCI Europe UCITS ETF EUR dis | 0,06% p.a. |
Alle MSCI Europe-ETFs nach Gesamtkostenquote sortiert
Für die Auswahl eines MSCI Europe-ETF sind neben der Wertentwicklung weitere Faktoren für die Entscheidungsfindung wichtig. Zum besseren Vergleich findest du eine Liste aller MSCI Europe-ETFs mit Angaben zu Größe, Kosten, Ertragsverwendung, Fondsdomizil und Replikationsmethode sortiert nach Fondsgröße.
Alle MSCI Europe-ETFs im Detail vergleichen
Alle MSCI Europe-ETFs im Chart-Vergleich
| ETF ISIN | Fondsgröße in Mio. EUR | TER in % | Ertrags- verwendung | Fonds- domizil | Replikations- methode | |
|---|---|---|---|---|---|---|
| iShares Core MSCI Europe UCITS ETF EUR (Acc)IE00B4K48X80 | 15.780 | 0,12% p.a. | Thesaurierend | Irland | Optimiertes Sampling | |
| iShares Core MSCI Europe UCITS ETF EUR (Dist)IE00B1YZSC51 | 10.636 | 0,12% p.a. | Ausschüttend | Irland | Optimiertes Sampling | |
| Xtrackers MSCI Europe UCITS ETF 1CLU0274209237 | 7.670 | 0,12% p.a. | Thesaurierend | Luxemburg | Vollständige Replikation | |
| Amundi Core MSCI Europe UCITS ETF AccLU1437015735 | 4.162 | 0,12% p.a. | Thesaurierend | Luxemburg | Vollständige Replikation | |
| UBS Core MSCI Europe UCITS ETF EUR disLU0446734104 | 1.544 | 0,06% p.a. | Ausschüttend | Luxemburg | Vollständige Replikation | |
| Deka MSCI Europe UCITS ETFDE000ETFL284 | 1.433 | 0,30% p.a. | Ausschüttend | Deutschland | Vollständige Replikation | |
| iShares Core MSCI Europe UCITS ETF EUR (Acc)IE000MAO75G5 | 1.229 | 0,12% p.a. | Thesaurierend | Irland | Optimiertes Sampling | |
| Amundi MSCI Europe UCITS ETF AccFR0010261198 | 613 | 0,25% p.a. | Thesaurierend | Frankreich | Vollständige Replikation | |
| UBS Core MSCI Europe UCITS ETF EUR accLU0950668524 | 564 | 0,06% p.a. | Thesaurierend | Luxemburg | Vollständige Replikation | |
| Xtrackers MSCI Europe UCITS ETF 1DLU1242369327 | 478 | 0,12% p.a. | Ausschüttend | Luxemburg | Vollständige Replikation | |
| Amundi Core MSCI Europe UCITS ETF DistLU1737652310 | 450 | 0,12% p.a. | Ausschüttend | Luxemburg | Vollständige Replikation | |
| State Street SPDR MSCI Europe UCITS ETF EURIE00BKWQ0Q14 | 394 | 0,08% p.a. | Thesaurierend | Irland | Vollständige Replikation | |
| HSBC MSCI Europe UCITS ETF EURIE00B5BD5K76 | 356 | 0,10% p.a. | Ausschüttend | Irland | Vollständige Replikation | |
| Ossiam MSCI Europe UCITS ETF 1C/A (EUR)LU3046617984 | 169 | 0,12% p.a. | Thesaurierend | Luxemburg | Swap-basiert | |
| BNP Paribas Easy MSCI Europe UCITS ETF AccLU3086268573 | 115 | 0,06% p.a. | Thesaurierend | Luxemburg | Vollständige Replikation | |
| HSBC MSCI Europe UCITS ETF EUR (Acc)IE000ZQOIPB1 | 103 | 0,10% p.a. | Thesaurierend | Irland | Vollständige Replikation | |
| Invesco MSCI Europe UCITS ETFIE00B60SWY32 | 58 | 0,19% p.a. | Thesaurierend | Irland | Unfunded Swap |
Quelle: justETF.com; Stand: 31.07.26
Die folgende Tabelle zeigt Ihnen die Wertentwicklung aller ETFs auf den MSCI Europe im Vergleich. Alle Angaben zur Wertentwicklung sind per Monatsende und inklusive Ausschüttungen. Neben der Wertentwicklung zu einem Stichtag ist für den Vergleich von ETFs die Wertentwicklung im Zeitverlauf entscheidend. Nutze hierfür auch unseren Chartvergleich.
| ETF | 1 Monat in % | 3 Monate in % | 6 Monate in % | 1 Jahr in % | 3 Jahre in % | |
|---|---|---|---|---|---|---|
| Xtrackers MSCI Europe UCITS ETF 1C | 3,16% | 13,05% | 11,26% | 22,33% | 50,63% | |
| Xtrackers MSCI Europe UCITS ETF 1D | 3,17% | 13,04% | 11,24% | 22,32% | 50,61% | |
| UBS Core MSCI Europe UCITS ETF EUR dis | 3,07% | 12,53% | 10,96% | 22,22% | 50,87% | |
| Amundi Core MSCI Europe UCITS ETF Acc | 3,04% | 12,50% | 10,91% | 22,13% | 50,56% | |
| iShares Core MSCI Europe UCITS ETF EUR (Acc) | 3,02% | 12,47% | 10,90% | 22,13% | 50,75% | |
| Amundi Core MSCI Europe UCITS ETF Dist | 3,03% | 12,49% | 10,90% | 22,11% | 50,54% | |
| Amundi MSCI Europe UCITS ETF Acc | 3,07% | 12,50% | 10,90% | 22,07% | 50,32% | |
| iShares Core MSCI Europe UCITS ETF EUR (Dist) | 3,03% | 12,47% | 10,91% | 22,07% | 50,73% | |
| HSBC MSCI Europe UCITS ETF EUR | 3,01% | 12,49% | 10,88% | 22,03% | 50,63% | |
| HSBC MSCI Europe UCITS ETF EUR (Acc) | 2,99% | 12,45% | 10,86% | 22,01% | 50,63% | |
| State Street SPDR MSCI Europe UCITS ETF EUR | 3,02% | 12,47% | 10,92% | 22,01% | 50,36% | |
| iShares Core MSCI Europe UCITS ETF EUR (Acc) | 3,02% | 12,36% | 10,89% | 22,00% | - | |
| Invesco MSCI Europe UCITS ETF | 3,03% | 12,43% | 10,82% | 21,93% | 50,19% | |
| Ossiam MSCI Europe UCITS ETF 1C/A (EUR) | 3,02% | 12,25% | 10,63% | 21,74% | - | |
| Deka MSCI Europe UCITS ETF | 3,00% | 12,35% | 10,71% | 21,73% | 49,57% | |
| BNP Paribas Easy MSCI Europe UCITS ETF Acc | 3,04% | 12,51% | 10,89% | - | - | |
| UBS Core MSCI Europe UCITS ETF EUR acc | 3,08% | 12,57% | 10,97% | - | - |
Quelle: justETF.com; Stand: 30.06.26; Angaben in EUR inkl. Ausschüttungen
Mit einem ETF-Sparplan hast du die Möglichkeit, regelmäßig Geld in einen MSCI Europe-ETF zu investieren. Sparpläne auf den MSCI Europe-Index kannst du bei Online Brokern anlegen. Diese bieten dir Top-Konditionen für das regelmäßige Sparen in börsengehandelte Indexfonds. Doch nicht jeder MSCI Europe-ETF ist bei jedem Online Broker als Sparplan verfügbar. Wir zeigen dir, wo du welchen MSCI Europe-ETF besparen kannst. Ob ein MSCI Europe Sparplan verfügbar ist, bestimmt die jeweilige Bank und nicht der Produkt-Anbieter.
Für das Besparen eines MSCI Europe-ETF benötigst du in jedem Fall ein Depot. Gut zu wissen: Bei den auf unserer Seite aufgeführten Online Brokern zahlst du in der Regel keine Depotgebühr. Die Einrichtung eines Depots ist in wenigen Minuten online erledigt. Außerdem bieten zahlreiche Online Broker eine Auswahl an ETF-Sparplänen als Aktionsangebot für 0,00 Euro Gebühr pro Sparrate an. Durch die Angebote von Neobrokern wie Scalable Capital, Trade Republic und Co. ist das ETF-Sparen inzwischen bei manchen Brokern sogar komplett kostenlos möglich.
Ein weiterer Vorteil eines ETF-Sparplans für den MSCI Europe-Index sind die niedrigen Produktkosten. Aktiv gemanagte Fonds sind in der Regel um einiges teurer und schaffen es nur äußerst selten, eine bessere Rendite als ETFs zu erzielen. ETFs bieten daher klare Vorteile, wenn du effizient Vermögen aufbauen willst. Somit gilt der ETF-Sparplan als eine der kostengünstigsten und besten Möglichkeiten der Altersvorsorge von heute. Wie du mit einem ETF-Sparplan Vermögen aufbauen kannst, veranschaulicht dir unser ETF-Sparplan-Rechner.
Ein MSCI Europe Sparplan kann mittlerweile ab einer monatlichen Sparrate von 1 Euro bei Brokern wie zum Beispiel Scalable Capital, Trade Republic oder ING abgeschlossen werden. Bei den meisten anderen Direktbanken kannst du ab 10, 25 oder 50 Euro pro Monat in einen MSCI Europe-ETF ansparen. Einen Vergleich der Sparplan-Modalitäten findest du in unserem ETF-Sparplan-Vergleich. Die nachfolgende Tabelle gibt dir einen Überblick über das Angebot für MSCI Europe Sparpläne. Der angezeigte Broker bietet dir das aktuell beste Angebot für eine Sparrate in Höhe von 100,00 Euro.
| Fondsgröße 15.780 Mio. Euro Kostenquote 0,12% p.a. 19 ETF-Sparpläne (15 kostenlos) für IE00B4K48X80 0,00€ Gebühr für 100€ Sparrate Zum Angebot* |
| Fondsgröße 10.636 Mio. Euro Kostenquote 0,12% p.a. 19 ETF-Sparpläne (15 kostenlos) für IE00B1YZSC51 0,00€ Gebühr für 100€ Sparrate Zum Angebot* |
| Fondsgröße 7.670 Mio. Euro Kostenquote 0,12% p.a. 20 ETF-Sparpläne (17 kostenlos) für LU0274209237 0,00€ Gebühr für 100€ Sparrate Zum Angebot* |
| Fondsgröße 4.162 Mio. Euro Kostenquote 0,12% p.a. 11 ETF-Sparpläne (10 kostenlos) für LU1437015735 0,00€ Gebühr für 100€ Sparrate Zum Angebot* |
| Fondsgröße 1.544 Mio. Euro Kostenquote 0,06% p.a. 14 ETF-Sparpläne (10 kostenlos) für LU0446734104 0,00€ Gebühr für 100€ Sparrate Zum Angebot* |
| Fondsgröße 1.433 Mio. Euro Kostenquote 0,30% p.a. 12 ETF-Sparpläne (8 kostenlos) für DE000ETFL284 0,00€ Gebühr für 100€ Sparrate Zum Angebot* |
| Fondsgröße 1.229 Mio. Euro Kostenquote 0,12% p.a. 10 ETF-Sparpläne (9 kostenlos) für IE000MAO75G5 0,00€ Gebühr für 100€ Sparrate Zum Angebot* |
| Fondsgröße 613 Mio. Euro Kostenquote 0,25% p.a. 18 ETF-Sparpläne (14 kostenlos) für FR0010261198 0,00€ Gebühr für 100€ Sparrate Zum Angebot* |
| Fondsgröße 564 Mio. Euro Kostenquote 0,06% p.a. 3 ETF-Sparpläne (3 kostenlos) für LU0950668524 0,00€ Gebühr für 100€ Sparrate Zum Angebot* |
| Fondsgröße 478 Mio. Euro Kostenquote 0,12% p.a. 17 ETF-Sparpläne (14 kostenlos) für LU1242369327 0,00€ Gebühr für 100€ Sparrate Zum Angebot* |
| Fondsgröße 450 Mio. Euro Kostenquote 0,12% p.a. 18 ETF-Sparpläne (16 kostenlos) für LU1737652310 0,00€ Gebühr für 100€ Sparrate Zum Angebot* |
| Fondsgröße 394 Mio. Euro Kostenquote 0,08% p.a. 15 ETF-Sparpläne (11 kostenlos) für IE00BKWQ0Q14 0,00€ Gebühr für 100€ Sparrate Zum Angebot* |
| Fondsgröße 356 Mio. Euro Kostenquote 0,10% p.a. 13 ETF-Sparpläne (9 kostenlos) für IE00B5BD5K76 0,00€ Gebühr für 100€ Sparrate Zum Angebot* |
| Fondsgröße 169 Mio. Euro Kostenquote 0,12% p.a. 2 ETF-Sparpläne (2 kostenlos) für LU3046617984 0,00€ Gebühr für 100€ Sparrate Zum Angebot* |
| Fondsgröße 115 Mio. Euro Kostenquote 0,06% p.a. 5 ETF-Sparpläne (4 kostenlos) für LU3086268573 0,00€ Gebühr für 100€ Sparrate Zum Angebot* |
| Fondsgröße 103 Mio. Euro Kostenquote 0,10% p.a. 7 ETF-Sparpläne (6 kostenlos) für IE000ZQOIPB1 0,00€ Gebühr für 100€ Sparrate Zum Angebot* |
| Fondsgröße 58 Mio. Euro Kostenquote 0,19% p.a. 14 ETF-Sparpläne (10 kostenlos) für IE00B60SWY32 0,00€ Gebühr für 100€ Sparrate Zum Angebot* |
ETF-Sparplan-Angebote für eine Sparrate in Höhe von EUR 100,00
Quelle: justETF.com; Stand: 31.07.26, Rendite per Monatsende in Euro
— Neben den angegebenen Gebühren der Online Broker können zusätzliche Kosten anfallen. Die genannten Gebühren sind somit zzgl. marktüblicher Spreads, Zuwendungen, Produktkosten und Fremdkosten.
* Du möchtest ein Depot eröffnen? Nutzt du dafür einen der mit Sternchen gekennzeichneten oder bei den Broker-Logos hinterlegten Affiliate Links als Ausgangspunkt, erhalten wir eine Vergütung. So finanzieren wir in weiten Teilen unser kostenfreies Informationsangebot. Wenn dir unsere Arbeit gefällt, freuen wir uns über deine Unterstützung! Übrigens gehören wir seit 2021 zur Scalable Gruppe. Um Interessenskonflikte zu vermeiden, legen wir seit jeher bei allen Vergleichen, Artikeln und Tests neutrale, objektiv nachvollziehbare Kriterien an und größten Wert darauf, dass DU allein entscheidest, wie und bei wem du investierst. Bitte beachte dabei: Investitionen in Wertpapiere bergen Risiken.